QR Code Tracking & Analytics

Track the scanning activity of your Dynamic QR Codes with Scanova's QR tracker
to understand user engagement and optimize strategies

Start Free Trial Book a Demo
14-day free trial | No credit card required

Experience the power of analytics

Get a 360-degree view of scanning activity with Scanova's advanced QR Code tracking features
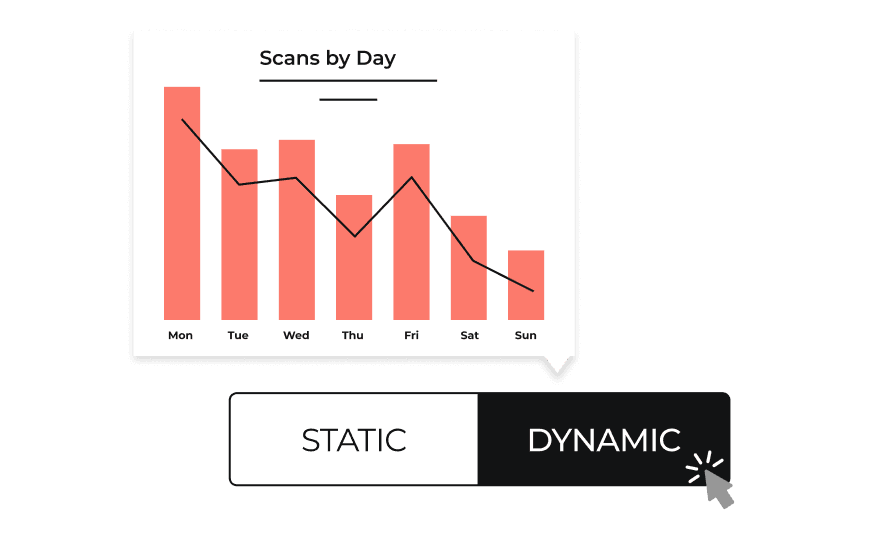
Weekly bar-graph showing easy and simple set up of dynamic QR Code tracking & analytics of QR Code scans.

Easy setup

With just a few clicks, you can generate Dynamic QR Codes that not only direct users to specific content but also track scan activity. This feature eliminates the need for complex setups or coding, allowing businesses to quickly implement QR Codes into their strategies.
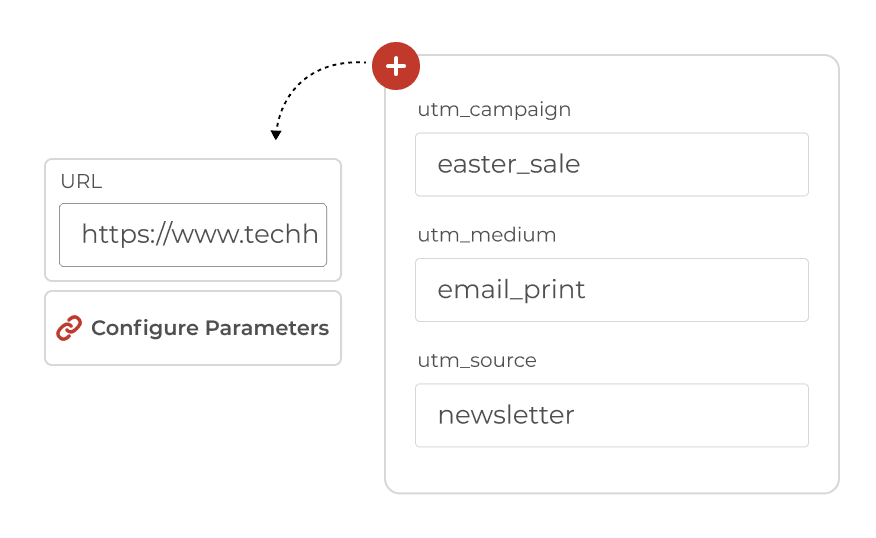
User configuring parameters to track the source, medium, and campaign associated with the QR Code traffic

UTM Parameters for Tracking

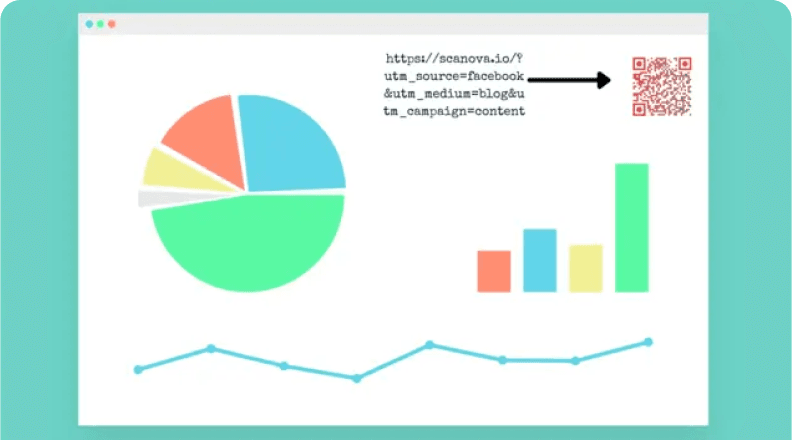
UTM parameters are tags you can add to your URLs that allow you to track the exact source, medium, campaign, content, and search terms associated with the QR Code traffic. By embedding these parameters, you can see in your analytics tools—like Google Analytics—which QR Code placements or marketing materials are driving traffic and conversions.
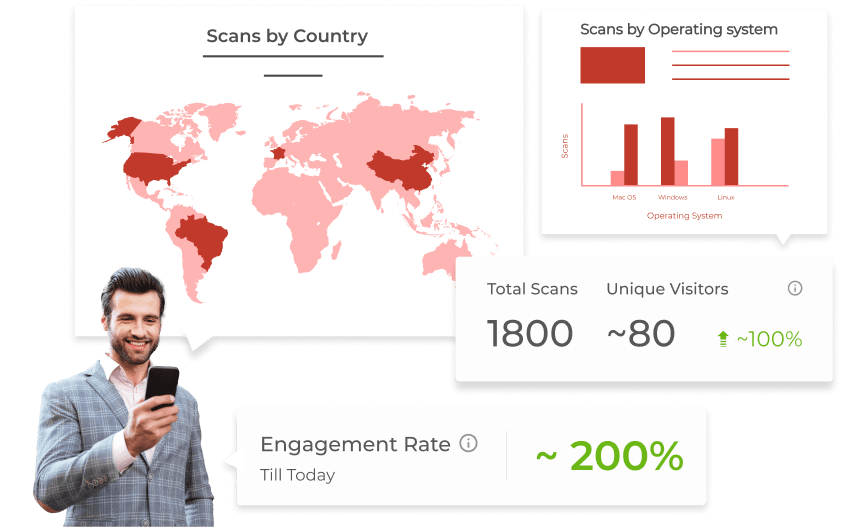
A man monitoring QR Code scans through graphs of country and operating system, along with metrics for QR Code tracking.

Monitor the scans on your QR Code & more

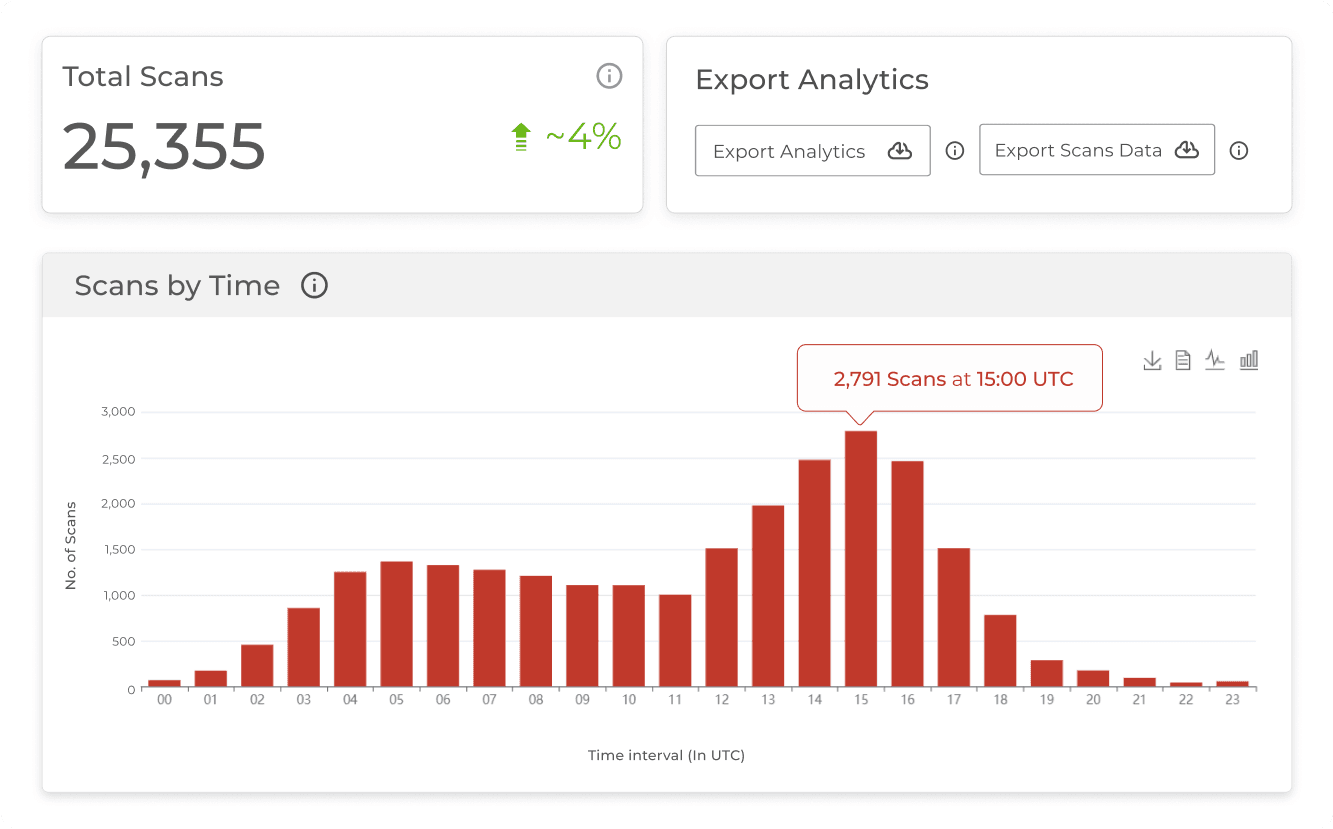
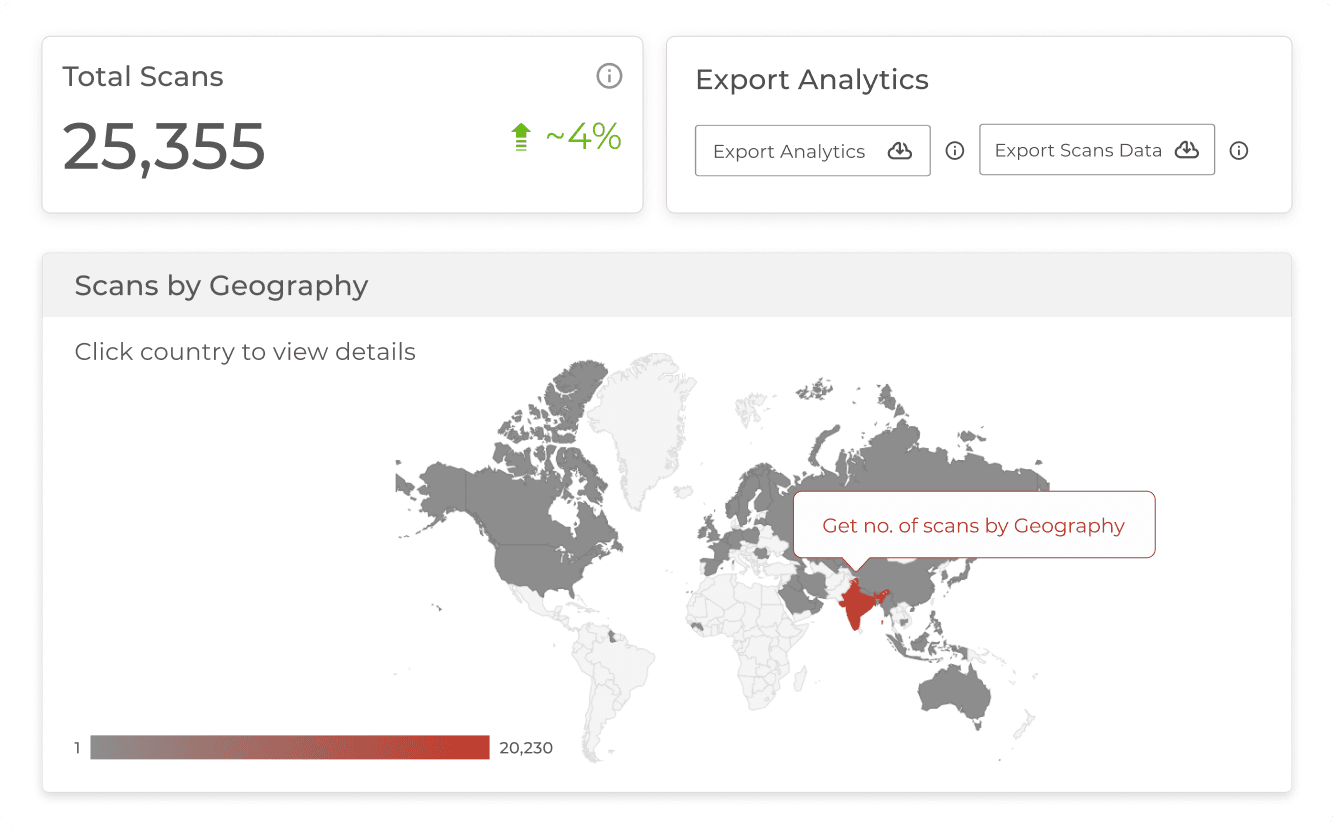
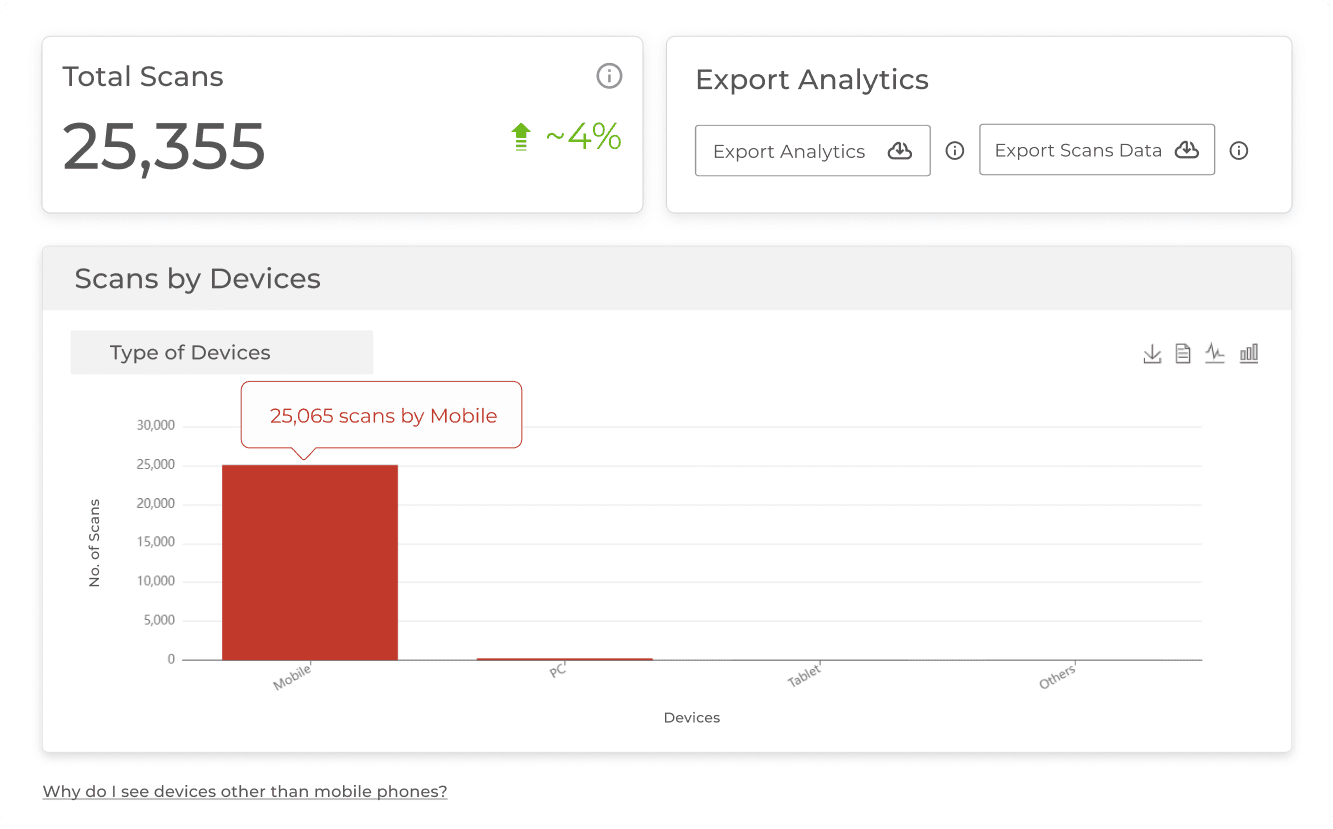
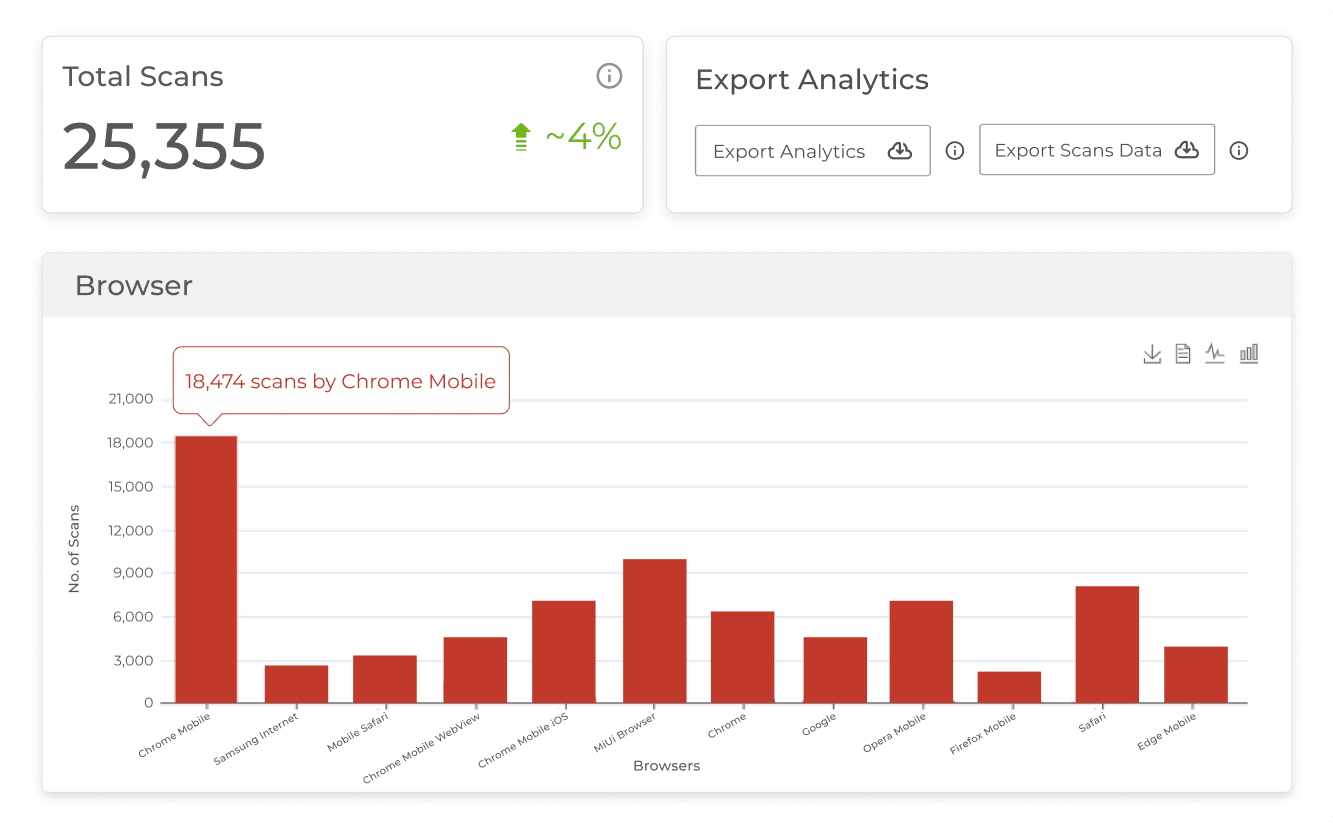
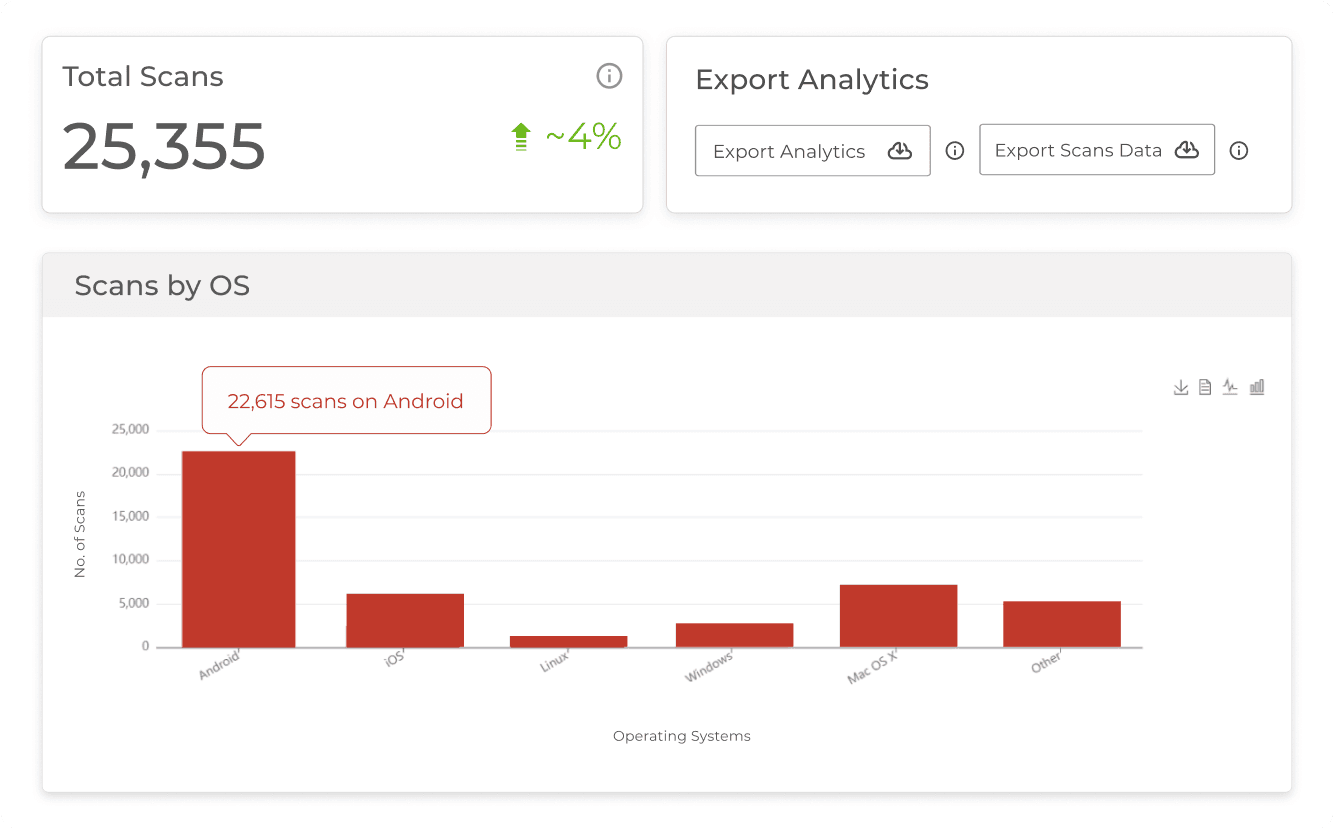
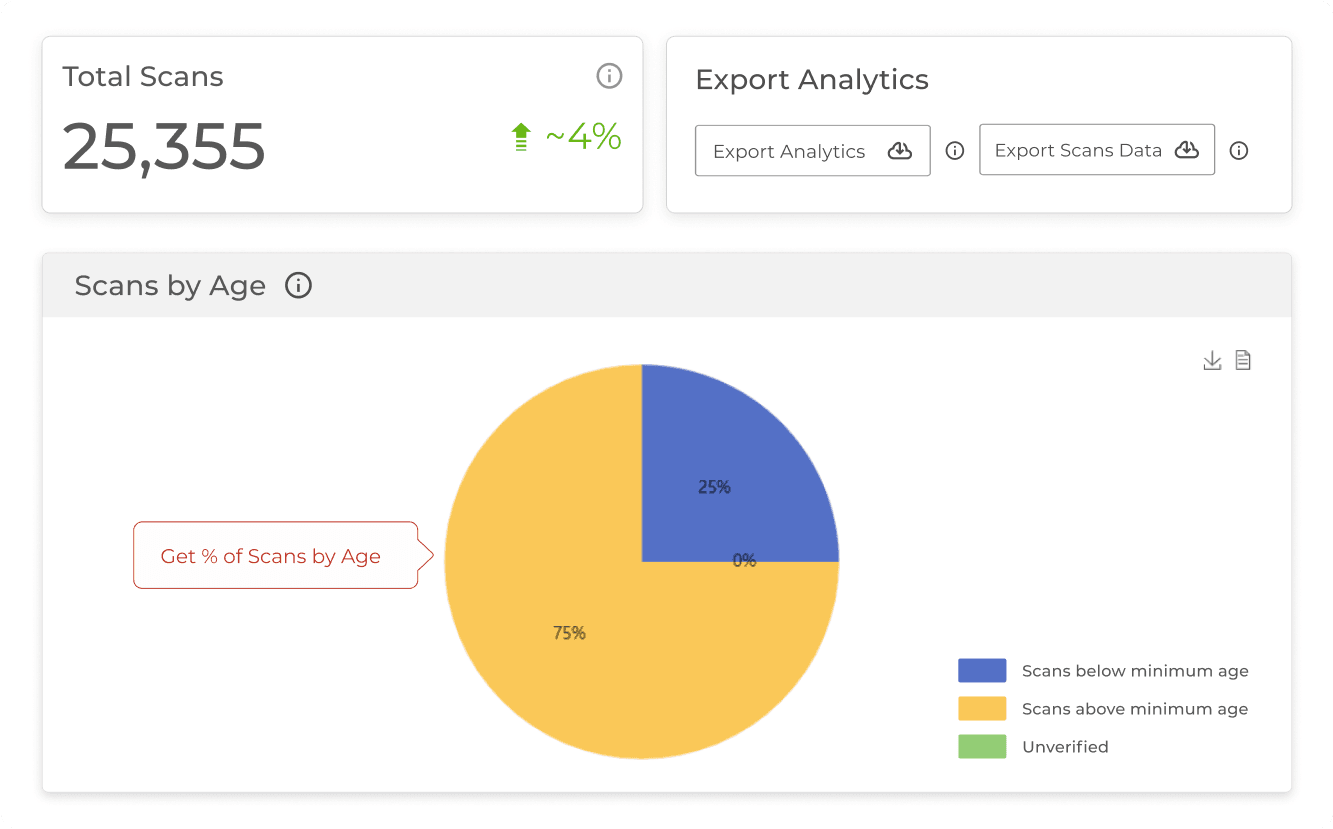
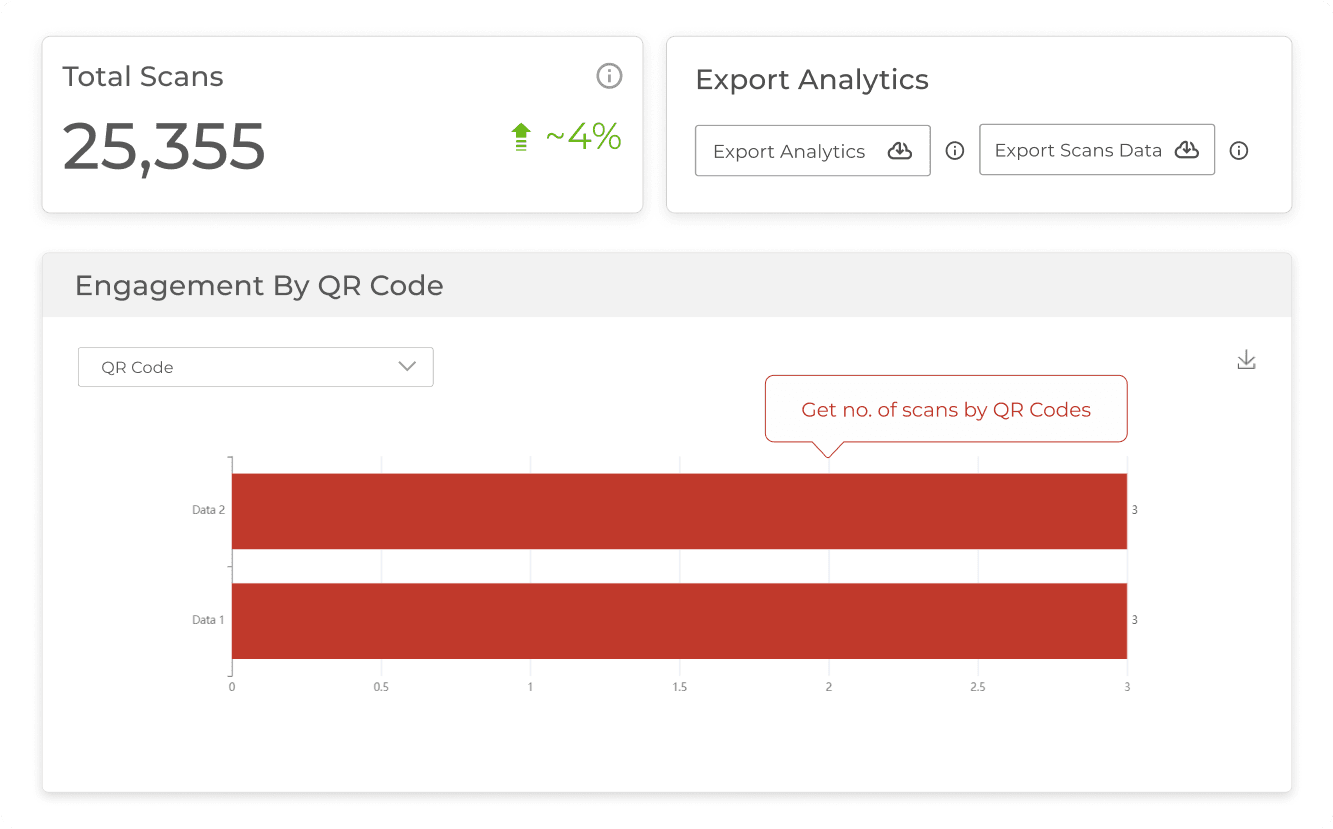
Gain in-depth insights into your QR Code performance with detailed analytics. Get data on the number of scans by date, day, time, city, country, type of device, browser, operating system, and handset. This helps you gauge the effectiveness of your campaigns and allows for targeted marketing strategies.
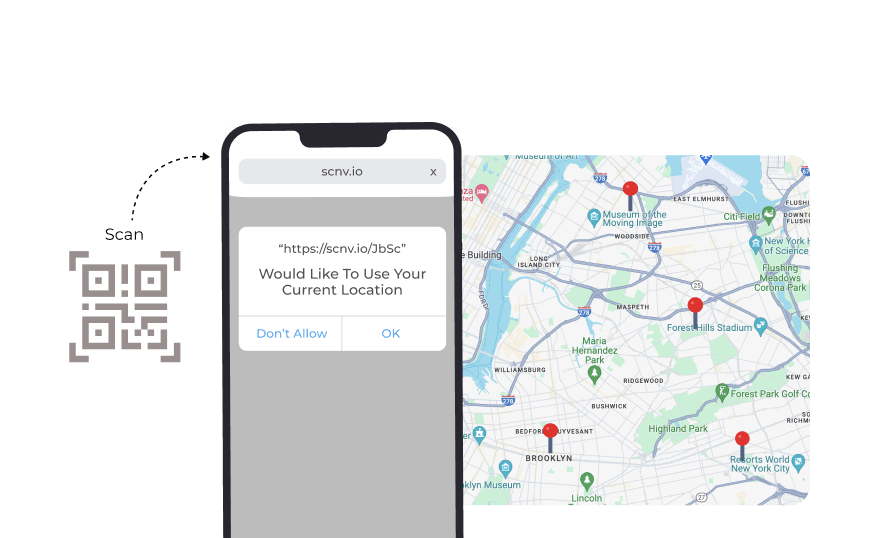
Smartphone showing a request for location access showing QR Code Tracking feature for tracking scans by exact GPS location.

Track scans by exact GPS location

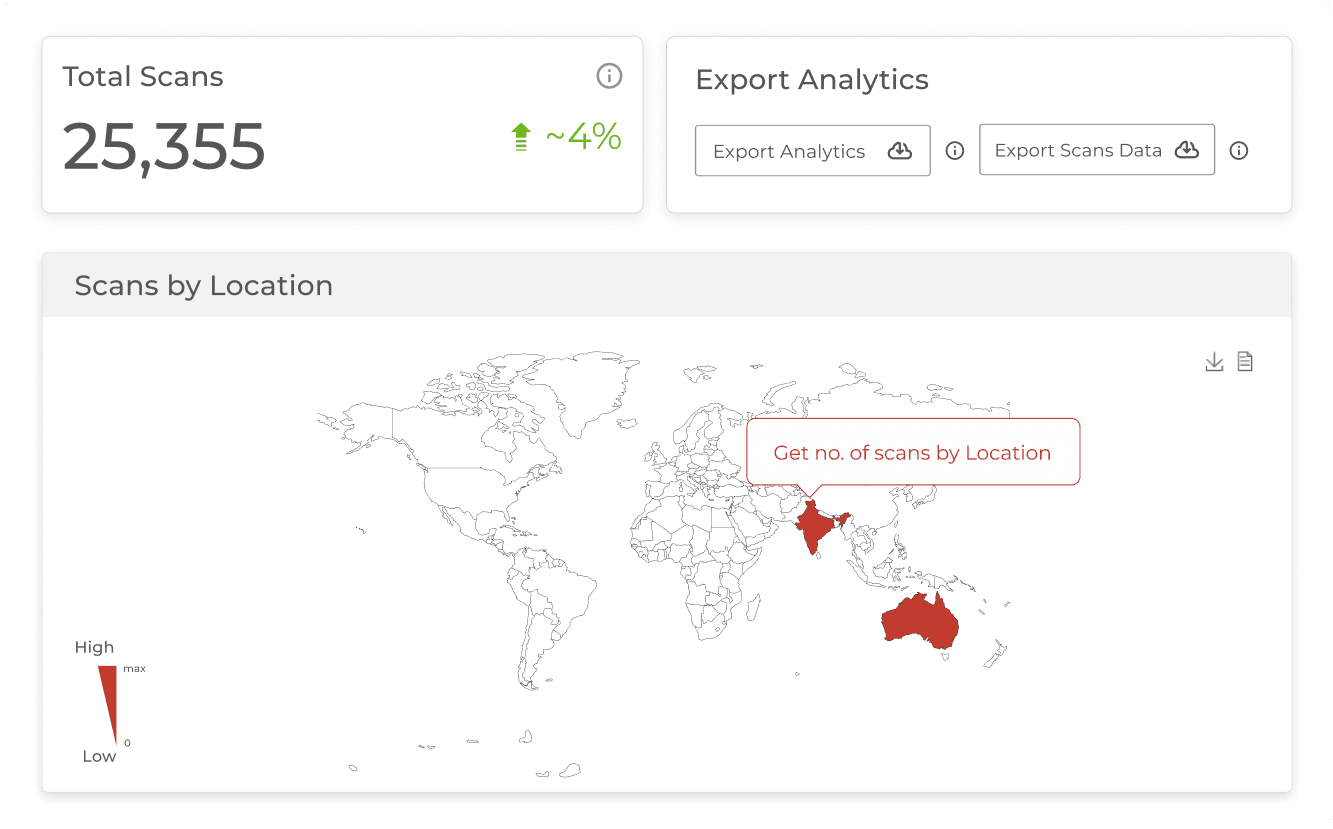
With user's permission, get the exact GPS location of each scanning device. Understand where users are engaging with your QR Codes, enabling targeted marketing efforts. Analyzing scan activity across different regions, helping to identify high-interest areas for future campaigns.
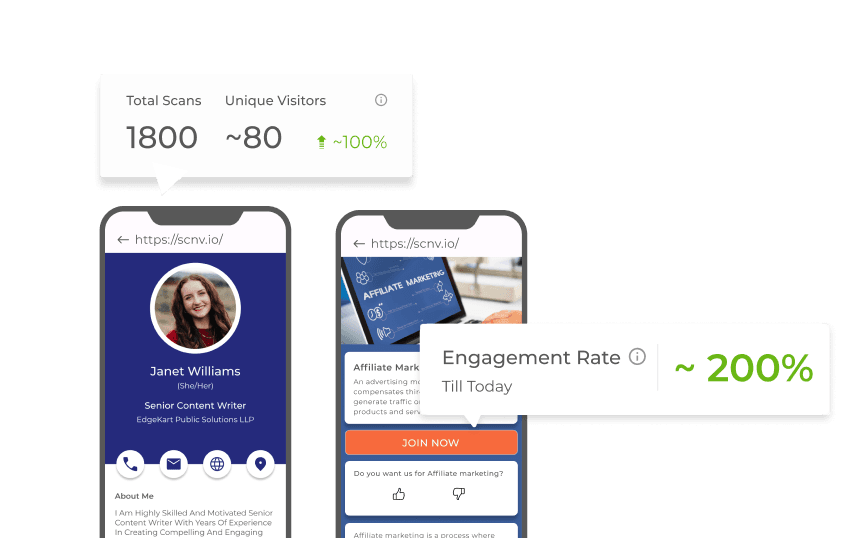
Two smartphone screens showing QR Code event tracking metrics for actionable elements like buttons and custom landing pages.

Event tracking

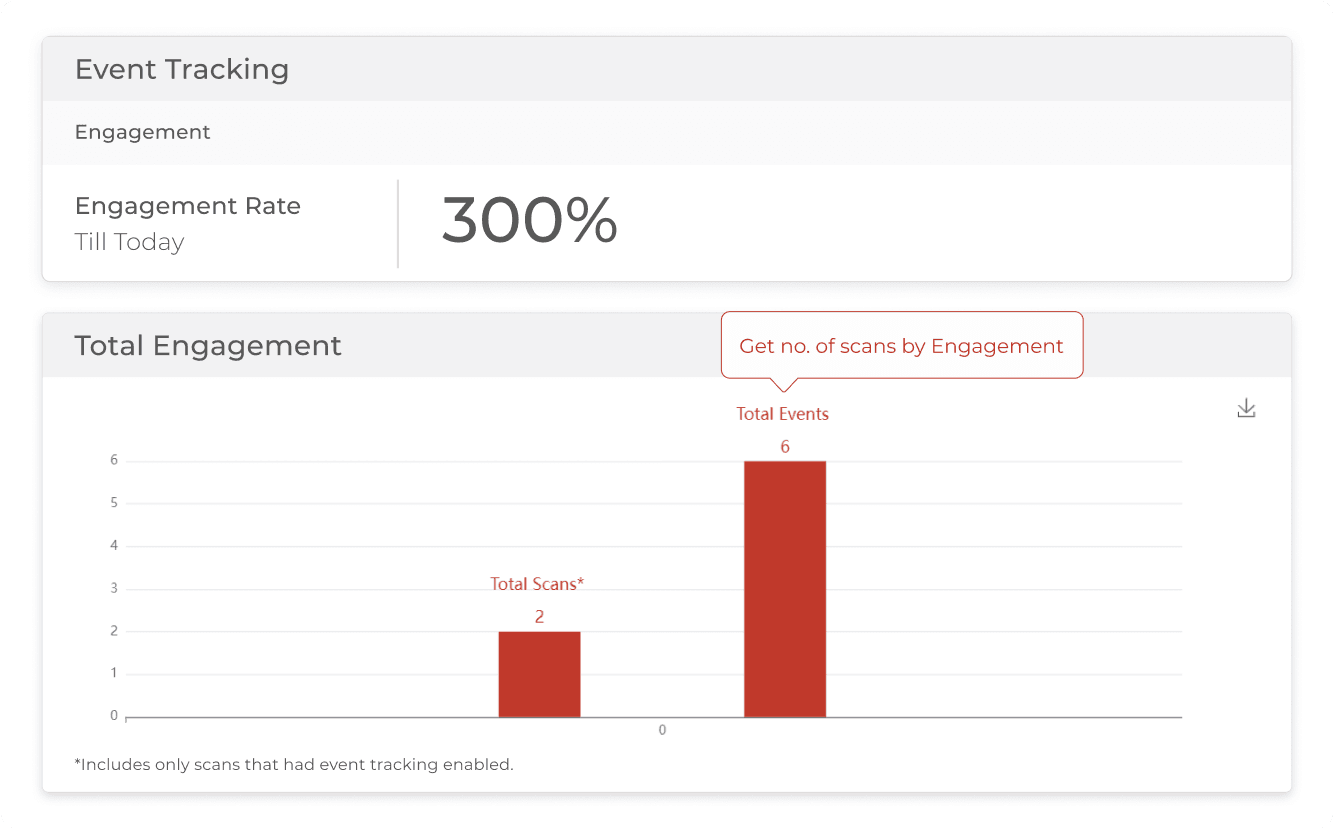
Utilize this feature to monitor clicks and engagement rates for actionable elements like buttons, as well as for various landing pages such as custom pages, product pages, business card profiles, and pages comprising social media links. This comprehensive tracking enables you to optimize your campaigns.
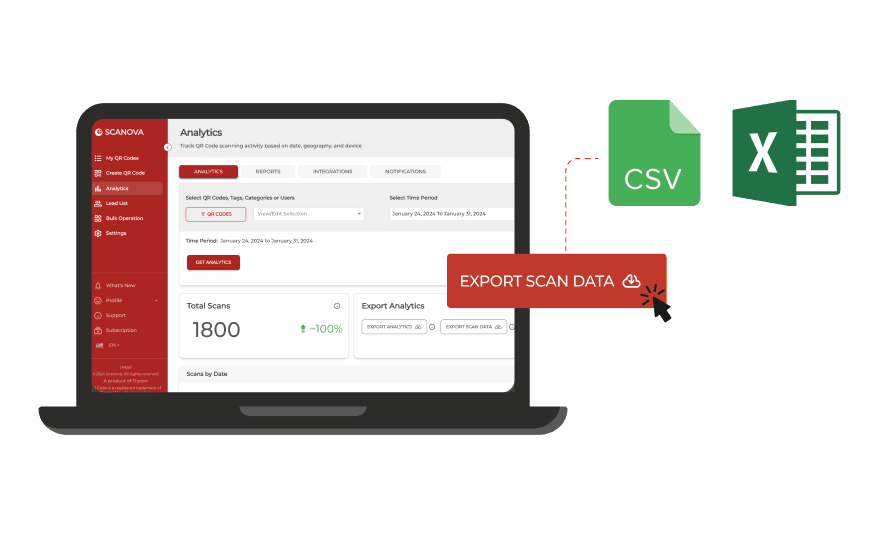
A computer screen displaying options to export scan QR data in CSV or Excel format for QR Code Tracking & Analytics.

Export scans data

Exporting your scan data is simple and efficient. You can download aggregate or detailed scan-level data in CSV or Excel formats. These detailed reports can be shared with stakeholders to demonstrate campaign effectiveness and inform decisions.
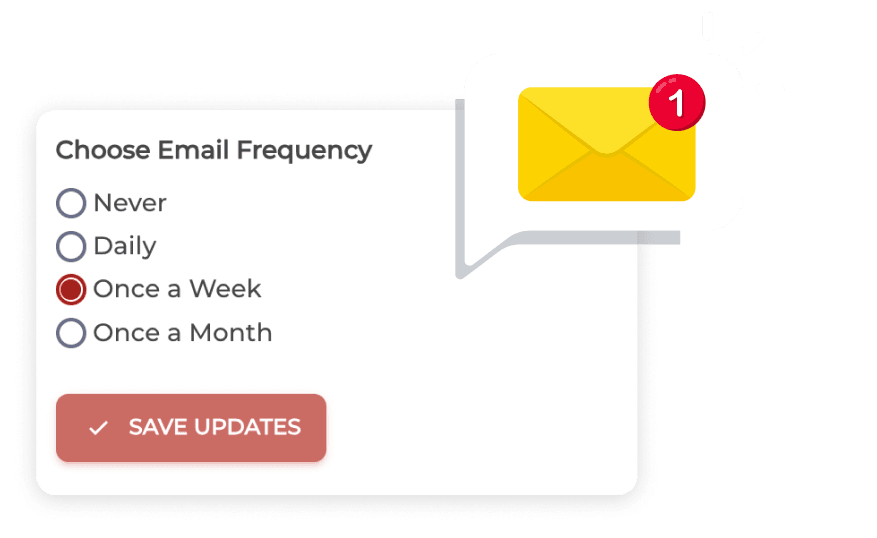
Scanova's QR  tracker showing options to receive analytics reports via email with various frequencies for better decisions.

Notifications

Receive analytics data directly in your email inbox through scheduled reports. This feature ensures you are always updated on your QR Code performance without needing to log into the dashboard constantly. Regular notifications help in quickly adapting marketing strategies based on real-time data insights.
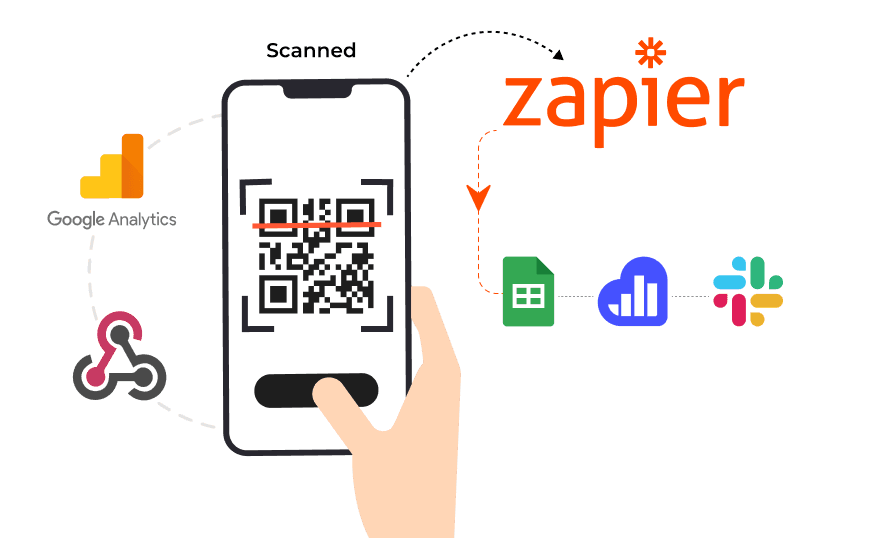
A Mobile screen scanning trackable QR Code for Google Analytics or webhook integration to send scan data to compatible apps.

Seamless integration

Get all your analytics data in one place with either Google Analytics or Webhooks integration. When a QR Code is scanned, you can use webhooks and an integration service provider like Zapier to send the scan data (date, time, location, etc.) to any compatible app such as Google Sheets, Kissmetrics, Slack, etc.
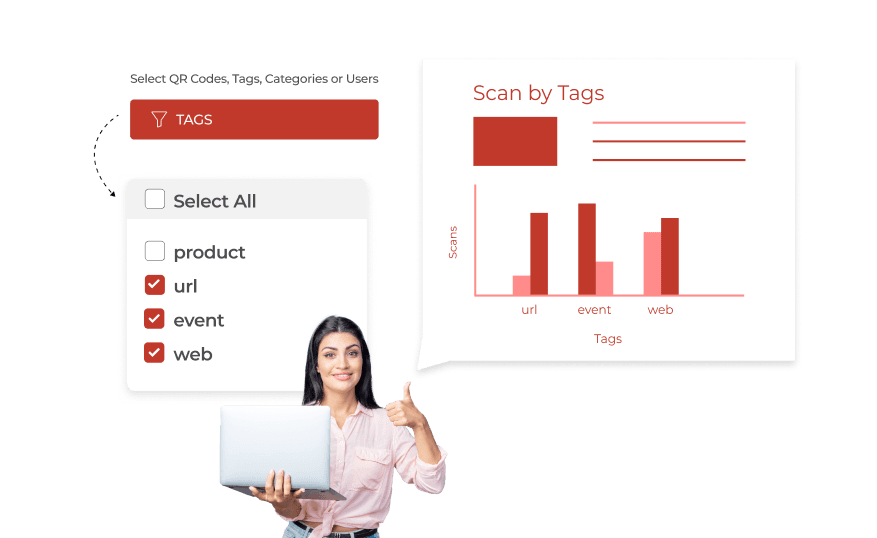
A woman using laptop to monitor QR scans, providing analytics at tag, user, and category levels in QR Code Tracking.

Tag-level analytics

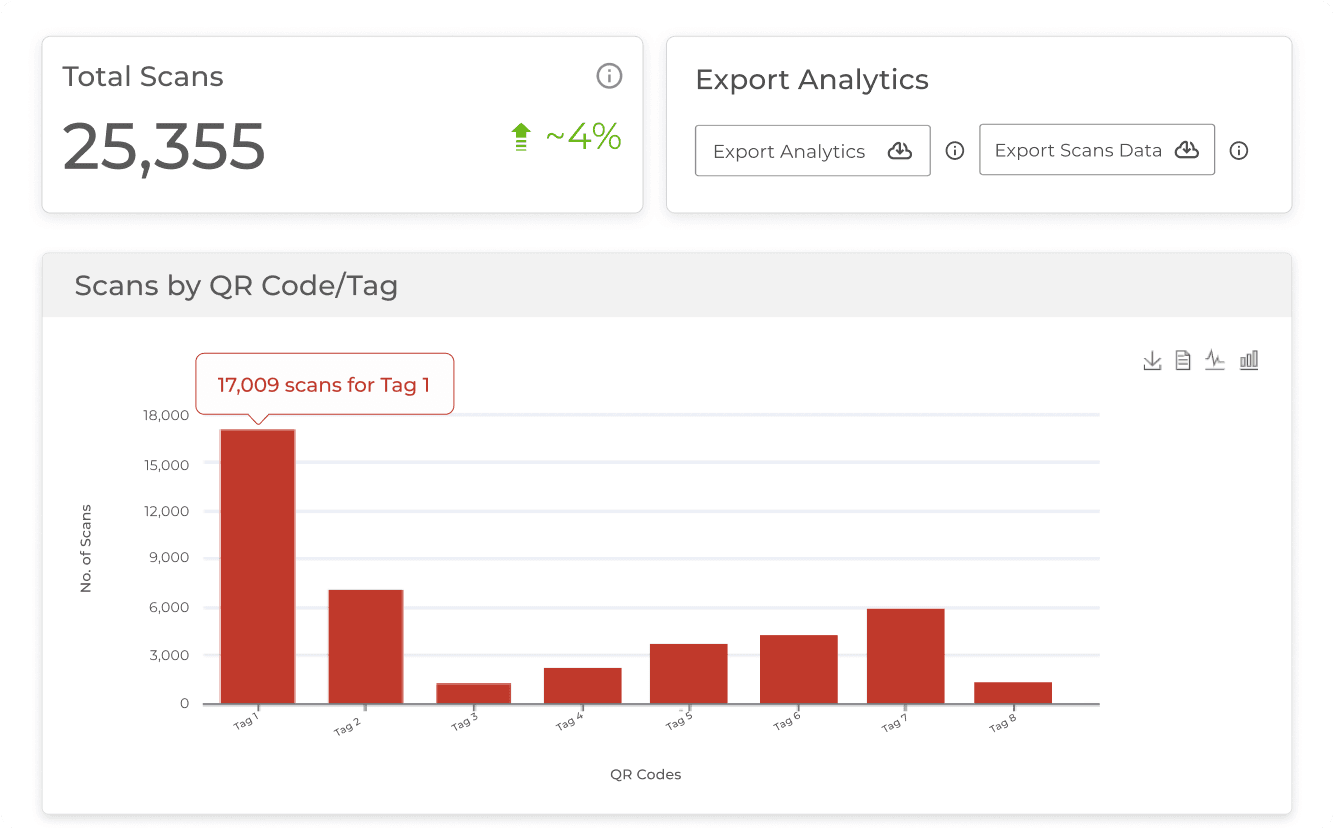
Ensure proper classification with tags. Get report and analytics data at tag, user, and category levels. Analyze performance based on specific tags assigned to each code. Gain deeper insights into user engagement at various levels, helping refine strategies tailored to different demographics or product lines.
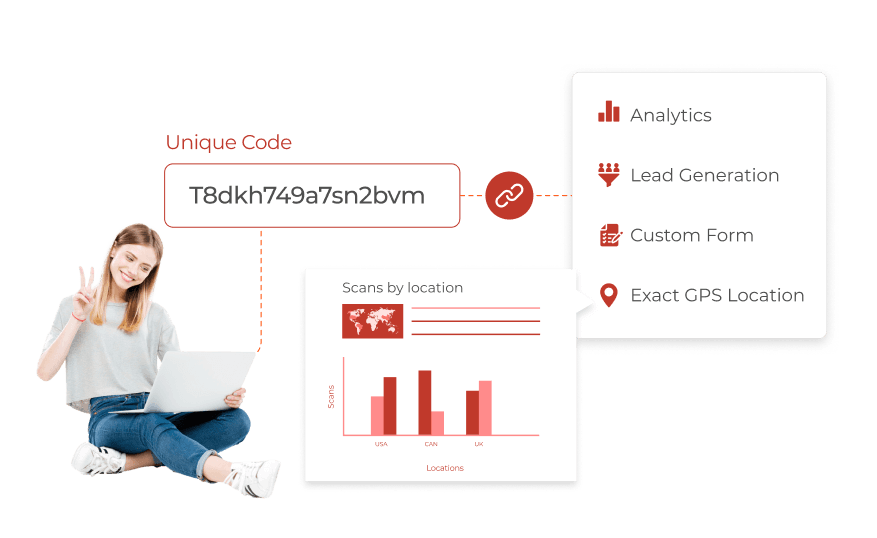
A woman with laptop tracking user data by linking a unique ID across scan tracking and more via QR Code tracking & Analytics.

End-user tracking

Enabling this option only maps data recorded via different features with the end-user's permission. It allows you to link a unique tracking ID across multiple features such as scan tracking & analytics, lead generation, custom form, and exact GPS location.

A scan total of 9,318 shown before and after the Exclude Bot traffic filter, with crawler, link preview and uptime monitor traffic accounting for the differenceAnalyticsTotal scans9,318Bot 1,900Search crawler1,204Link preview486Uptime monitor210Exclude Bot trafficAnalyticsHuman scans7,418Bot excludedDateLocationDeviceOS

Separate real scans from Bot traffic

Crawlers, link preview tools, security scanners, and uptime monitors all fetch the destination URL behind a QR Code, and every fetch lands in your scan count. Scanova identifies that automated traffic by device type and flags it as Bot, so switching on Exclude Bot traffic under Analytics, then Filters, leaves every breakdown — date, location, device, and OS — reporting human scans only.

A funnel from scan to page view to form start to purchase, with the drop-off between each step and the conversion value attributed to one QR CodeFunnelScan7,418Page view6,102-18%Form start2,240-63%Purchase648-71%Attributed toShelf talker AConversion value$18,94060-day window

See what happens after the scan

Conversion Tracking measures the scan itself and what scanners do after they visit your page. There is also a value and currency attached so that each code can be ranked by the value it brought. With its funnel analysis, you can also see on a graph where people drop out.

Two campaign folders compared side by side on total scans, with one folder's 30-day scan trend beside themFolder analyticsSpring Catalog18,40224 QR CodesIn-store Signage13,05011 QR CodesCompare folders, not codes one by oneSpring Catalog · last 30 daysPro Plan and above

Read the numbers for a whole campaign at once

One QR Code's scan count says little about the campaign. Group all codes into a folder and view analytics from that folder to see the insights reported as a unit. You can compare one folder with another easily to optimize your campaigns. Folders are available on the Pro Plan and above.
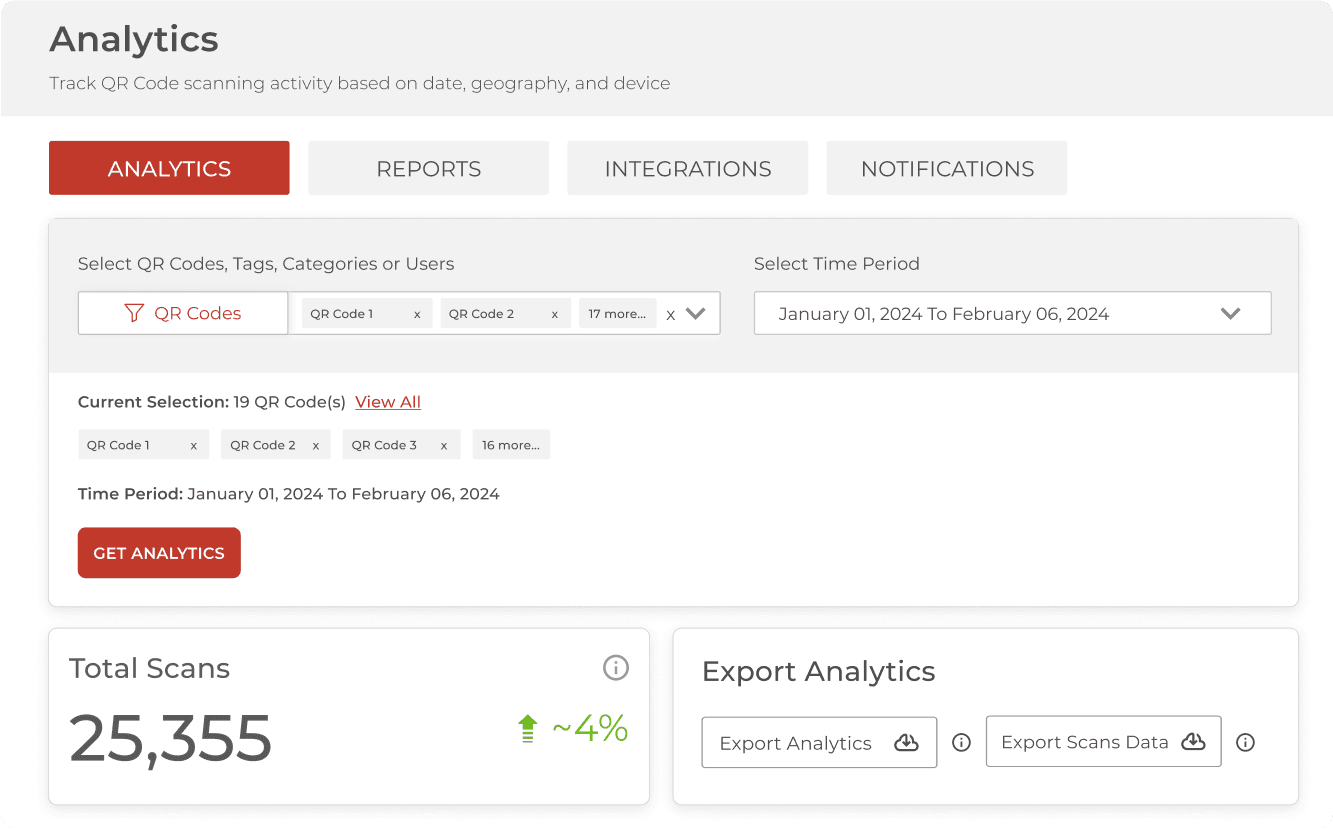
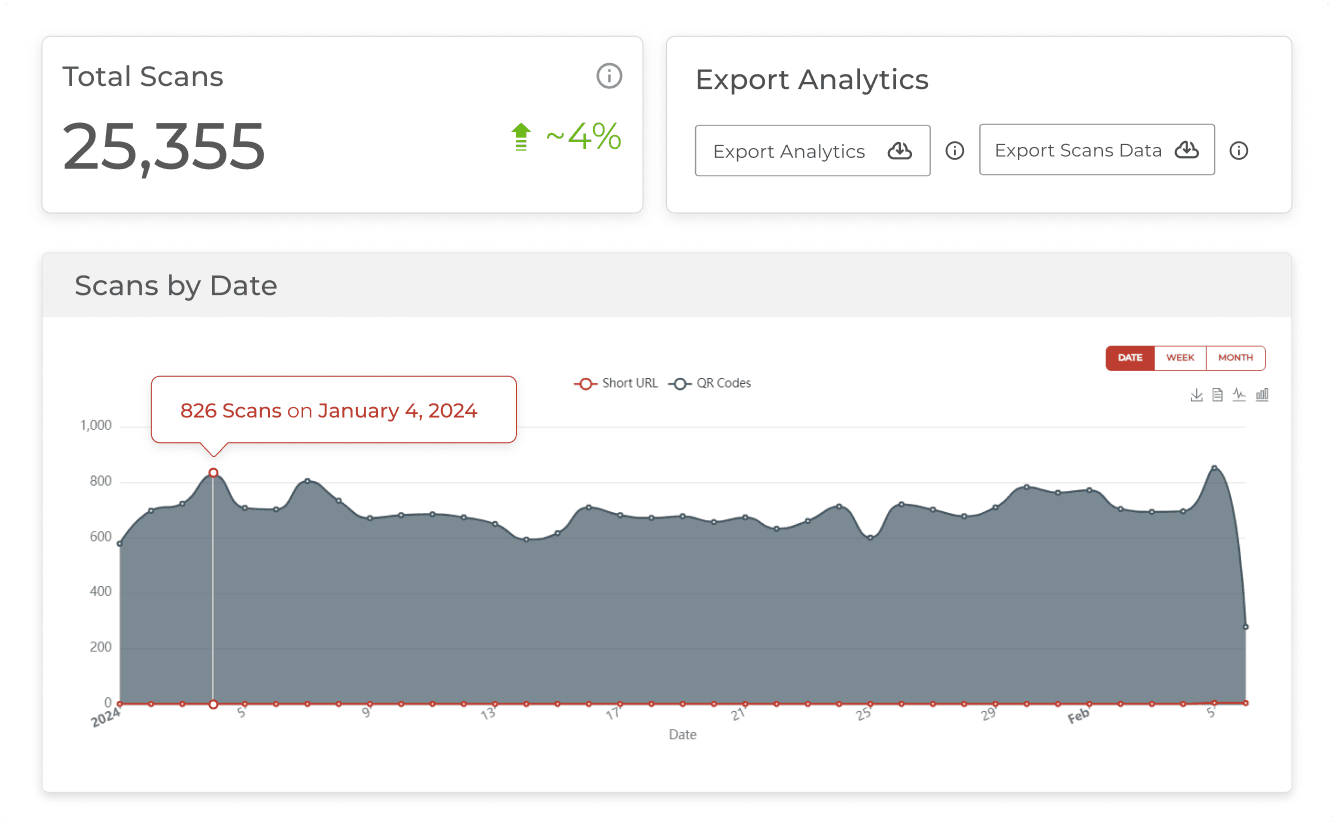
Gain valuable insights with real-time analytics

Get a detailed overview of your campaign’s performance

  • Analytics graph sample
  • Analytics graph sample
  • Analytics graph sample
  • Analytics graph sample
  • Analytics graph sample
  • Analytics graph sample
  • Analytics graph sample
  • Analytics graph sample
  • Analytics graph sample
  • Analytics graph sample
  • Analytics graph sample
  • Analytics graph sample
  • Analytics graph sample
Download Sample Data

Scanova is trusted by brands like Amazon, AT&T, and Walmart

HP's logo
Amazon's logo
Walmart's logo
Nestle's logo
AT&T's logo
Zynga's logo
Intel's logo
Fujifilm's logo
L’Oréal Paris's logo
Pepsico's Logo
Cisco's Logo
HP's logo
Amazon's logo
Walmart's logo
Nestle's logo
AT&T's logo
Zynga's logo
Intel's logo
Fujifilm's logo
L’Oréal Paris's logo
Pepsico's Logo
Cisco's Logo
Start Free Trial Book a Demo
14-day free trial | No credit card required

98% of QR Codes created are dynamic and trackable

Scanova’s internal data underscores the increasing need of real-time tracking

Retail

Retail

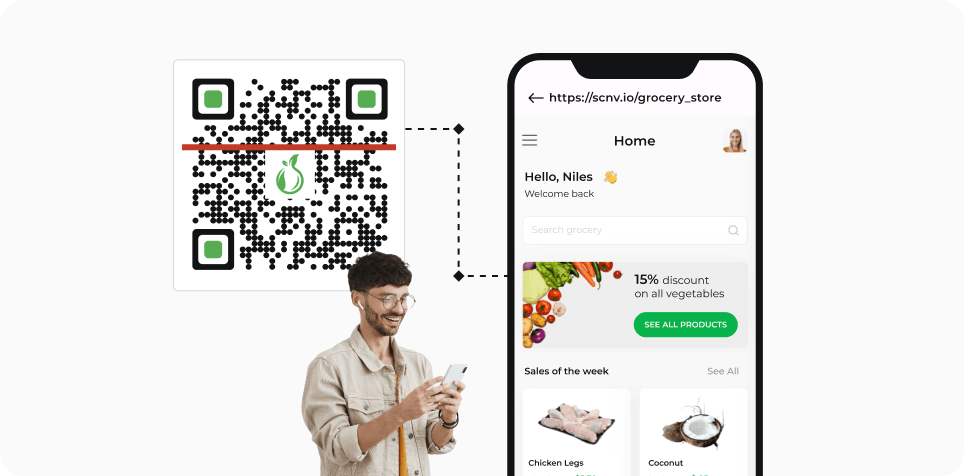
Dynamic QR Codes enable retail businesses to engage customers by redirecting them to promotional content, product information, or loyalty programs. By tracking scan data, retailers can analyze customer behavior and optimize marketing strategies—enhancing customer experience.

Dynamic QR Codes enable retail businesses to engage customers by redirecting them to promotional content, product information, or loyalty programs. By tracking scan data, retailers can analyze customer behavior and optimize marketing strategies—enhancing customer experience.

Hospitality

Hospitality

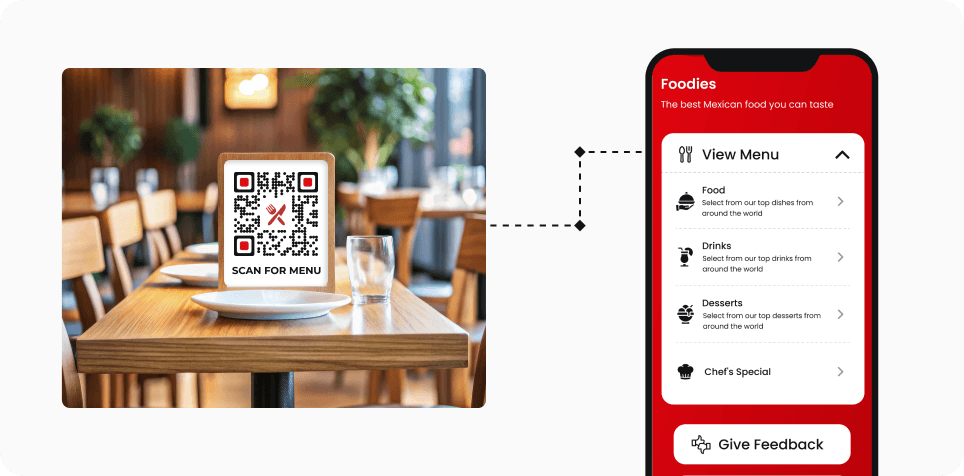
Dynamic QR Codes streamline menu access and the ordering process. Restaurants can update their menus instantly without reprinting codes, while analytics provide insights into guest engagement—allowing restaurants to actively work on improving guest experience.

Dynamic QR Codes streamline menu access and the ordering process. Restaurants can update their menus instantly without reprinting codes, while analytics provide insights into guest engagement—allowing restaurants to actively work on improving guest experience.

Real Estate

Real Estate

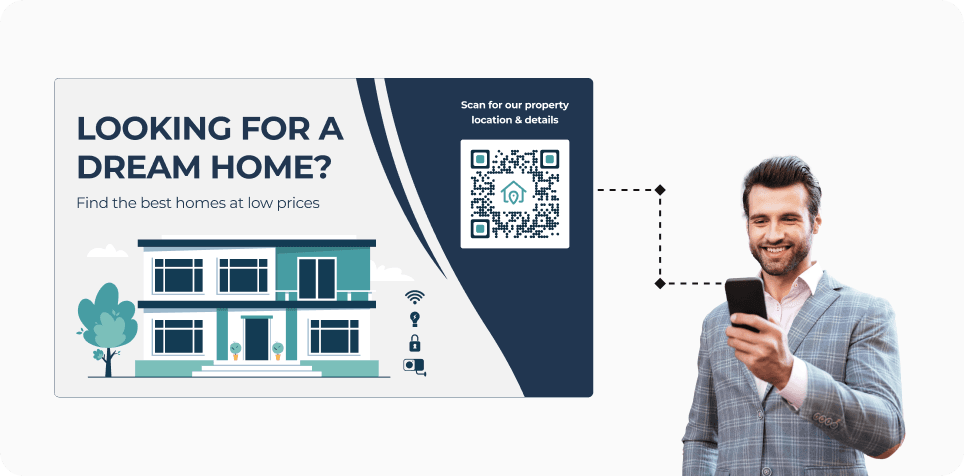
Real estate agents use Dynamic QR Codes to provide potential buyers with instant access to virtual tours and detailed property information. The tracking feature allows agents to gauge interest levels in specific properties, helping them tailor their listings.

Real estate agents use Dynamic QR Codes to provide potential buyers with instant access to virtual tours and detailed property information. The tracking feature allows agents to gauge interest levels in specific properties, helping them tailor their listings.

Event Management

Event Management

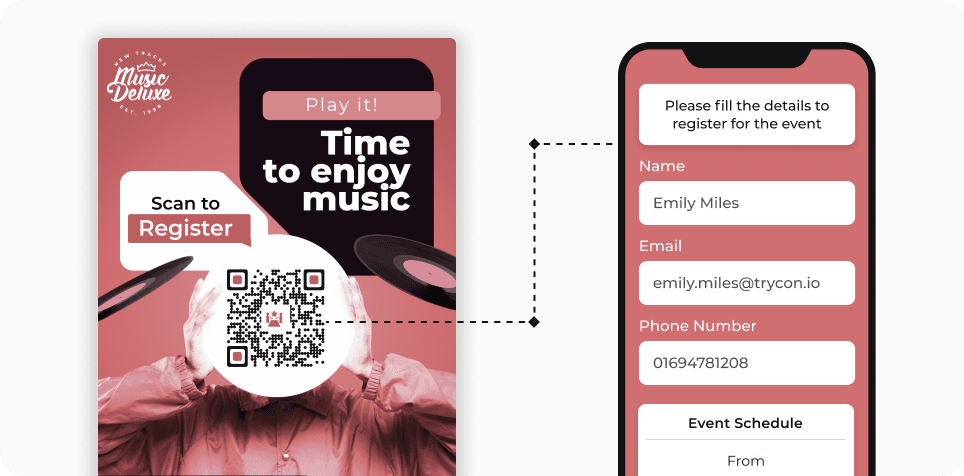
Event organizers use Dynamic QR Codes for sharing event and ticketing information. These codes can link to schedules or speaker bios that can be updated as needed. Tracking scans helps organizers understand attendee interests and optimize future events.

Event organizers use Dynamic QR Codes for sharing event and ticketing information. These codes can link to schedules or speaker bios that can be updated as needed. Tracking scans helps organizers understand attendee interests and optimize future events.

Product Packaging

Product Packaging

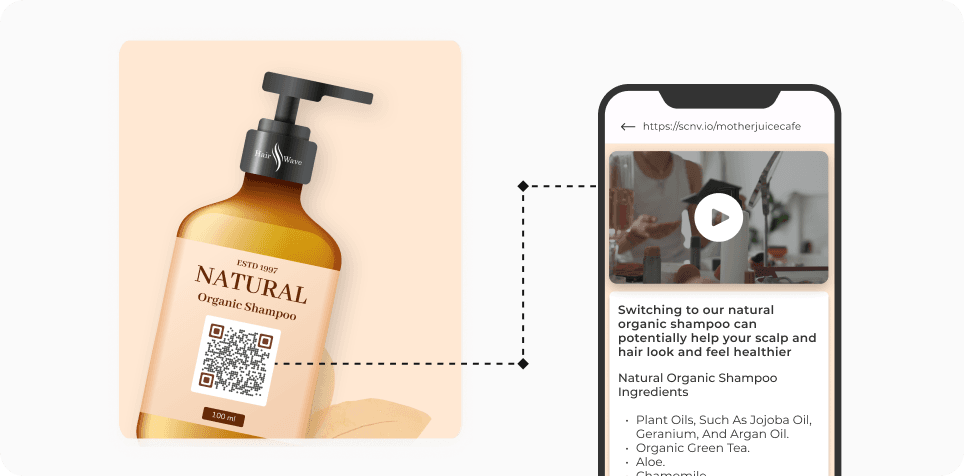
Brands are incorporating Dynamic QR Codes on packaging to provide consumers with additional product information, such as usage instructions or sustainability practices. The ability to track scans allows companies to measure consumer interest in specific features or promotions.

Brands are incorporating Dynamic QR Codes on packaging to provide consumers with additional product information, such as usage instructions or sustainability practices. The ability to track scans allows companies to measure consumer interest in specific features or promotions.

Education

Education

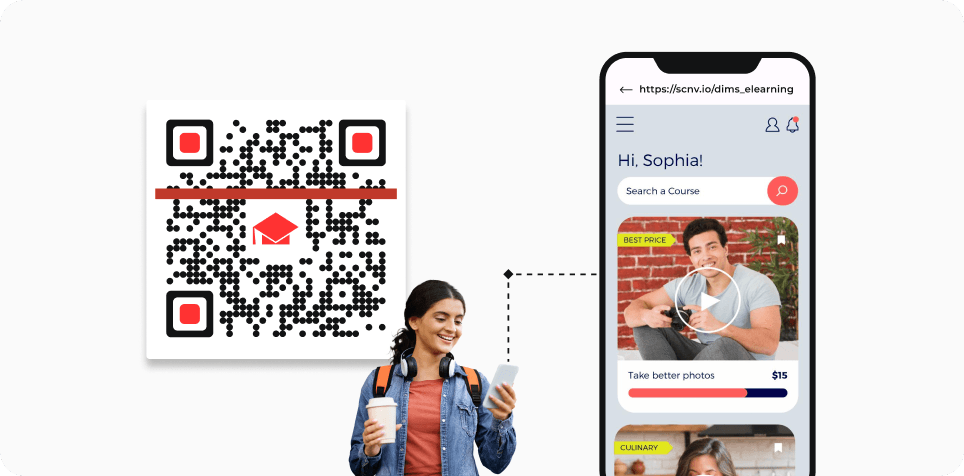
In educational settings, Dynamic QR Codes can be used for sharing detailed course materials. Analytics allow educators to monitor student engagement with resources, helping them identify which materials are most effective and where additional support may be needed.

In educational settings, Dynamic QR Codes can be used for sharing detailed course materials. Analytics allow educators to monitor student engagement with resources, helping them identify which materials are most effective and where additional support may be needed.

Get desired results for your business with Scanova’s Dynamic QR Generator

14-day free trial | No credit card required

Best brands in the world trust Scanova QR Code Generator

“The simplicity of this tool makes it easy for even non-tech users”

Easy to use and achieve successful outcomes with Scanova. The simplicity of this tool makes it easy for even non-tech users. Scanova solves the concern of tracking websites and data sheets efficiently.

Your security and privacy are important to us

Experience exceptional data protection with ISO/IEC 27001:2022, GDPR, and SOC2 compliance

ISO Certification Badge, symbolizing our commitment to high-quality QR Code solutions and industry standards.
SOC2 Compliance Badge
GDPR Compliance Badge

Frequently Asked Questions

Get quick answers related to Scanova’s trackable QR Codes

How can I track the performance of my QR Codes?

Scanova QR Code Generator with tracking feature helps you track the performance of your codes. You can track your QR Codes by monitoring metrics such as the number of scans, scan locations, device types, and engagement rates through detailed analytics. Additionally, with UTM parameters, you can also track the exact source, medium, and campaign details of your QR Code traffic in analytics platforms like Google Analytics, enabling deeper insights into which channels and campaigns are driving results.

How does GPS tracking work with QR Code scans?

With user permission, you can access the exact GPS location of each scanning device. This feature allows for precise location tracking of user interactions.

Is it possible to export my QR Code scan data?

Yes, you can export both aggregate and detailed scan-level data in CSV or Excel formats for efficient analysis and reporting.

Can I track user engagement on my landing pages using QR Codes?

Yes. You can monitor clicks and engagement rates for actionable elements like buttons on various landing pages—including custom pages, product pages, business card profiles, and social media links.

How will I receive analytics updates about my QR Codes?

You can set up regular reports to be sent directly to your email inbox, providing you with timely insights for informed decision-making and strategic planning. You can select an email frequency of your choice daily, once a week, or once a month.

Why are my QR Code scans higher than expected?

Some of those scans are almost certainly Bots. Search engine crawlers, link preview tools, security scanners, and uptime monitors fetch your QR Code's destination URL and register as scans. Turn on Exclude Bot traffic under Analytics, then Filters, to see human scans only.

How is QR Code Health Center different from analytics?

Analytics tells you how your QR Codes are performing. Health Center tells you whether they are working at all. It uses scan volume to rank which problems affect the most traffic.

Can I see analytics for a group of QR Codes together?

You can see analytics for a group of QR Codes together using Scanova's folders feature. Put the QR Codes in a folder, then open View Analytics from that folder to see the whole group's scan data in one report. Folders are available on the Pro Plan and above.
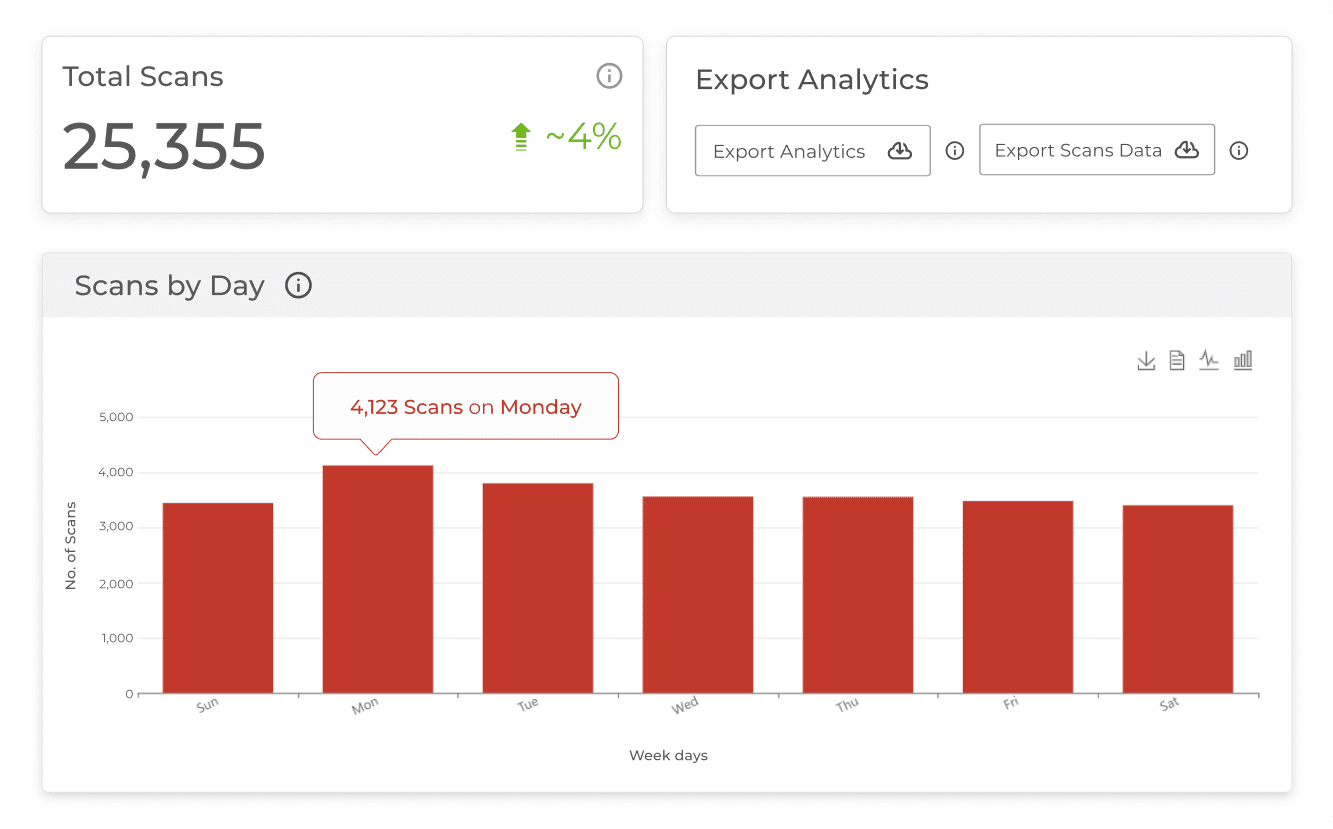
Discover how to use Scanova's tracking and analytics feature for your campaigns

Read More Articles

Unleash the full potential of Scanova

Enhance efficiency with Scanova’s powerful QR Code analytics features

Try Scanova for free | No credit card required