In a nutshell: You can track QR Code scans using Google Analytics by integrating it with Scanova’s Dynamic QR Codes. Adding UTM parameters helps you identify QR Code traffic in GA reports. Scanova’s Google Analytics integration supports both GA4 and Universal Analytics. You’ll get real-time data on scan events, devices, locations, and more, helping you optimize campaigns. This setup is privacy-compliant and requires no coding.
Tracking how people interact with your offline campaigns is tough, but not impossible.
With QR Codes, you can connect print materials, product packaging, or event banners directly to digital channels. But the real magic happens when you pair those QR Codes with Google Analytics.
By integrating Scanova’s Dynamic QR Codes with Google Analytics, you get real-time data on how users engage with your codes – what they scanned, when, where, and on which device.
This means better visibility, smarter decisions, and measurable ROI from every offline touchpoint.
In this guide, we’ll show you exactly how to set up this integration step by step – no complex coding needed.
Let’s begin!
A. What is QR Code tracking with Google Analytics
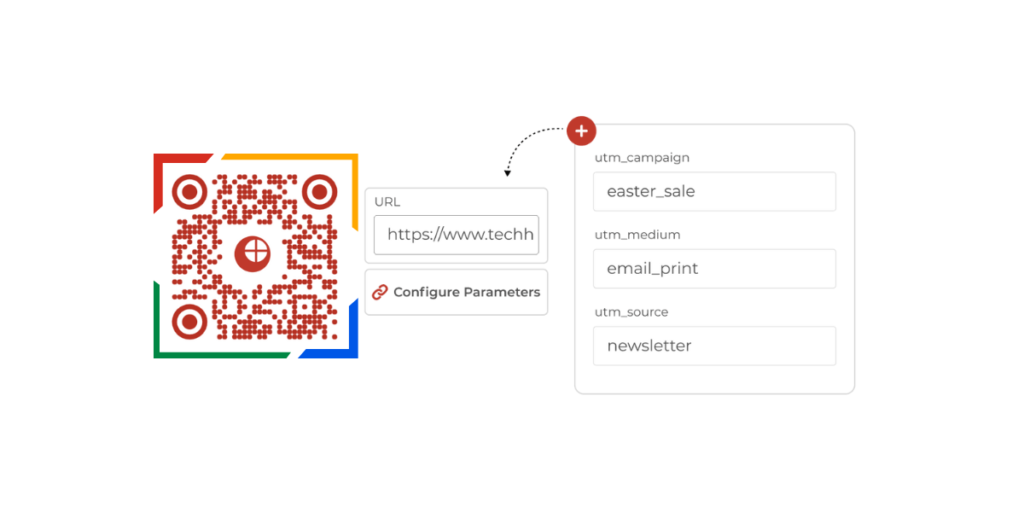
QR Code tracking with Google Analytics involves using UTM parameters within the QR Code’s URL to monitor and analyze the traffic generated from scans.
This allows you to see detailed metrics on user interactions, such as the number of scans, the time of scans, geographic locations, and the devices used, all within your Google Analytics dashboard.
B. How to track a QR Code?
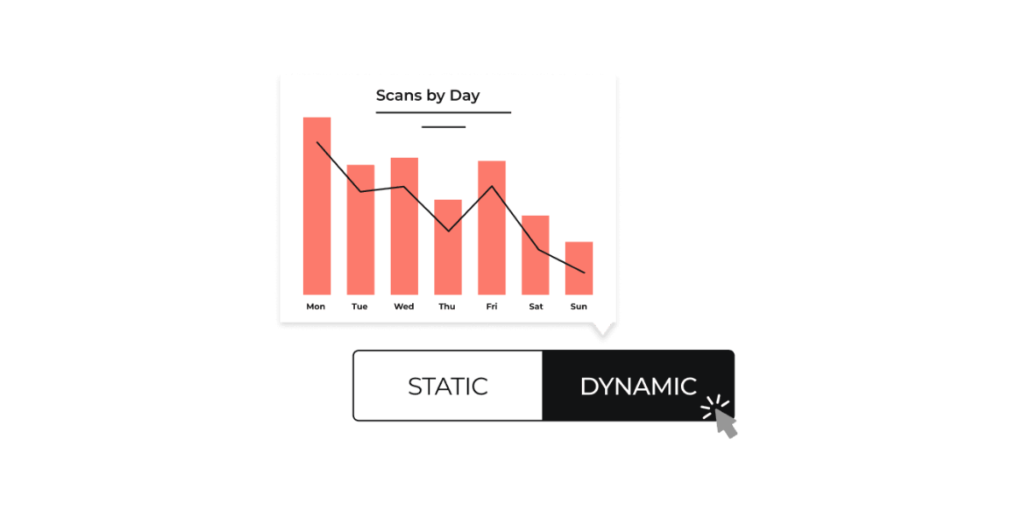
Static and Dynamic QR Codes are two different kinds of QR Codes.
Static QR Codes have fixed content embedded within the code. And these QR Codes have no scan tracking capabilities of their own.
On the other hand, Dynamic QR Codes are both editable and trackable. They allow you change content stored in them anytime. And also, you can track their scans in detail.
This flexibility allows businesses to track and optimize their QR Code campaigns.
It is better to track a QR Code by using dynamic QR Codes as opposed to static ones. With more flexibility and control, dynamic QR Codes enable more reliable tracking.
To track a QR Code, users may create a dynamic QR Code using a QR Code generator like Scanova. One can then set tracking parameters like campaign name, medium, or source to categorize and analyze scan data.
Further, share the QR Code across channels, collecting relevant data like location, time, device, and referral source.
C. How to track QR Code scans with Google Analytics?
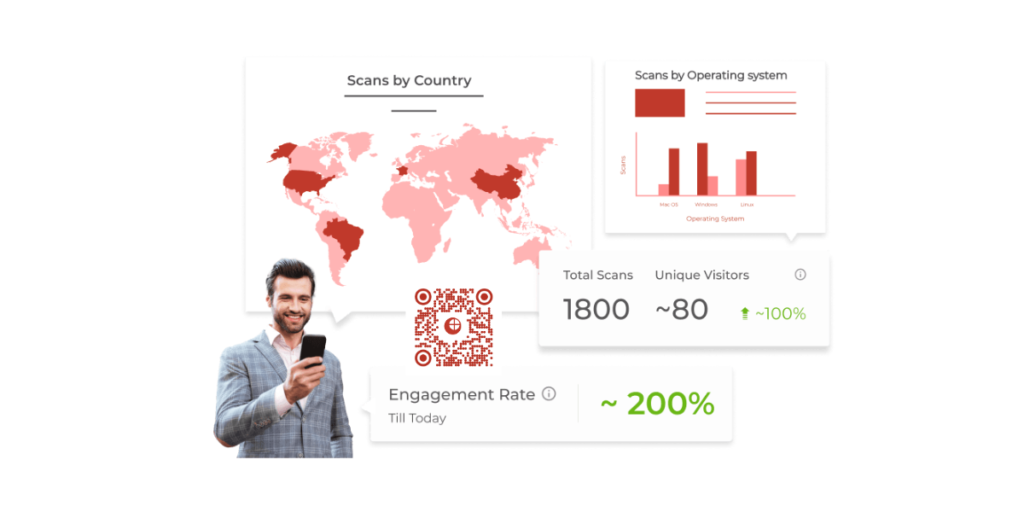
There exist two primary ways to track QR Codes with Google Analytics. First, one can generate Urchin Tracking Module (UTM) links and create QR Codes for each link using Google Analytics Campaign URL Builder.
But, this approach has some limitations:
It’s time-consuming and only gives a partial picture of the information in QR Codes.
That’s because Google Analytics only records users who went to the landing page for real. It doesn’t include users who left after scanning the QR Code because they needed clarification, lost interest, or expected a different outcome.
But, adding QR Codes as a data source in Google Analytics is another way to track QR Codes in the program.
By doing this, one can better understand the traffic patterns of each QR Code created, including whether the user visits the site or leaves after a short while.
To track QR Code activity using Google Analytics, you’ll need to use Scanova’s Dynamic QR Codes and enable Google Analytics integration for your campaigns. Here’s how to do it:
Step 1: Create a Dynamic QR Code
- Sign in to your Scanova account.
- Click on “Create QR Code” and select a dynamic QR Code type (e.g., Website URL, Google Form, etc.).
- Enter your destination URL and click “Next”.
- Customize the design (optional) and click “Create QR Code”.
Note: Only dynamic QR Codes support tracking and analytics integration.
Step 2: Add UTM Parameters (Optional but recommended)
To see QR Code traffic clearly in Google Analytics, add UTM parameters to your destination URL:
- utm_source=qr
- utm_medium=offline
- utm_campaign=your_campaign_name
Example:
https://yourdomain.com/page?utm_source=qr&utm_medium=offline&utm_campaign=summersale
This helps identify and compare traffic from your QR Codes vs. other channels.
Challenges with this method include generating UTM URLs for each QR Code. It can be time-consuming and prone to human error.
UTM parameters must also be managed to ensure consistency and accuracy.
Furthermore, UTM URLs may be lengthy and complicated, which may affect the appearance and functionality of QR Codes.
Step 3: Enable Google Analytics integration in Scanova
- Go to the Integrations section in your Scanova dashboard.
- Choose Google Analytics and click Connect.
- Log in with your Google account and authorize access.
- Select the desired GA property (Universal Analytics or GA4).
- Scanova will now automatically send event data to your Google Analytics account.
You can track events like:
- QR Code scanned
- Page visited after scan
- Location, device type, and browser
Step 4: View QR Code events in Google Analytics
Depending on your GA version:
For GA4:
- Go to Reports > Engagement > Events.
- Look for events like
scanova_qr_scanor use your UTM labels. - Use filters (source/medium = qr/offline) to isolate QR traffic.
For Universal Analytics:
- Go to Behavior > Events > Overview.
- Filter events based on category or use UTM data in Acquisition > Campaigns.
Step 5: Use insights to optimize campaigns
Now that you’re tracking scans:
- Compare performance across different QR Code placements
- Identify high-engagement locations, time of day, or devices
- Use real-time data to update landing pages or offers
D. Adding QR Codes directly as a property on Google Analytics
Use the steps below to add QR Codes directly as a property in Google Analytics.
- Sign in to your Google Analytics account
- Create a new property or use an existing property for tracking QR Code interactions
- Go to the Admin section and select the desired account and Property where you want to track QR Code data
- Under the Property column, click on “Custom Definitions” > “Custom Campaigns”
- Create a new custom campaign by entering the relevant information, such as source (QR Code), medium (print, digital), and campaign name (promotion name)
- Generate a custom campaign URL using the Google Analytics URL Builder or any other URL builder tool, which includes the custom campaign parameters
- Create a QR Code using a QR Code generator tool such as Scanova, and set the custom campaign URL as the destination URL for the QR Code
- Implement the QR Code on your marketing material, such as posters or product packaging
- Optionally, set up event tracking in Google Analytics to capture specific user interactions with the QR Code, such as scans
- Monitor QR Code interactions and campaign data in Google Analytics under “Acquisition” > “Campaigns” > “All Campaigns” or “Behavior” > “Events” (if event tracking is set up
E. Who can benefit from Google Analytics QR Code tracking?

Let’s examine each pointer in detail using several scenarios and a brief explanation:
1. Marketers at an apparel brand
Say an apparel store called “Fashion Fusion”. They link their online lookbooks to QR Codes shown on in-store posters.
They can determine which collections and styles generate the most interest by tracking these QR Codes with Google Analytics.
Doing so helps them with better stock selections and future marketing initiatives.
2. Furniture industry retailers
Assume that you own “Cozy Corners,” a furniture business. You want to provide customers with digital catalogs with images and reviews to influence them to buy.
So you attach a QR Code to each product tag, which, on scanning, shows them the digital media.
After some time, you may track these QR Codes to see which products incited customer interest to learn more about. This information shall help improve your online and in-store content.
3. Restaurants
Say you run an Italian bistro and print QR Codes on the table tents. These QRs connect to an online menu with promotions for the season.
Later, you check the scan data to monitor consumer interest in various dishes and promotions to modify menu items based on market demand.
4. Luxury property marketing by real estate agents
Say “Elite Estates,” a real estate company, markets its luxury properties with QR Codes on brochures to provide virtual tours and property descriptions.
Every week, they can revisit the scan data to determine properties drawing the most interest and adjust the follow-up tactics.
5. Campaigns for the environment run by nonprofits
Did you know that nonprofits often use QR Codes to inform people about their work and get donations via fliers and posters?
Using dynamic QRs here, they evaluate the success of their outreach initiatives and plan more successful campaigns by tracking scans.
What our customers say about us:
F. Misconceptions about QR Code tracking
There are several misconceptions about QR Code tracking. Hence, it is critical to define what QR Code tracking is and isn’t.
QR Code tracking gathers aggregated data on audience engagement without collecting identifiable information (PII). It does not invade privacy by tracking individual identities or browsing activities.
For instance, Scanova, a QR Code generator and tracking platform, offers tracking that captures scan location, time, device and browser used.
Some believe that QR Code tracking is complicated and requires technical expertise. In reality, many user-friendly platforms offer simple tracking solutions.
And it’s not expensive either. In truth, many basic tracking services are affordable or even free. By understanding the realities of QR Code tracking, businesses can utilize its potential to optimize marketing efforts effectively.
G. Advantages of Google Analytics QR Code
1. Measurable offline marketing
By connecting offline marketing initiatives to web analytics, QR Codes enable companies to assess the performance of their printed marketing collateral.
Without QRs, it’s not possible to gauge the exact performance or impact of your print media campaigns.
2. Detailed user insights
You can learn insights about users interacting with their QR Codes via Google Analytics, which offers extensive data on user behavior.
For example, it gives you detailed data on page views based on user demographics, age, devices, etc.
3. Customer journey tracking
If you’ve used Google Analytics, you’d know that it helps you track user journeys and funnels effectively.
So each time users scan the QR code to visit a website/landing page, your Analytics dashboard will map their journey effectively to show you their journey.
Brands that trust us:
H. Best practices
To help you maximize the effectivep0-[[oness of your QR Code initiatives, consider the following recommended practices:
1. Apply UTM parameters first
Why? Because UTM parameters monitor the traffic that your QR Codes create, including their source, medium, and campaign specifics.
Best Practice: When using URLs in your QR Codes, always use UTM parameters.
Use an example link, such as this one: https://www.example.com/?utm_campaign=SpringSale&utm_medium=QRcode.
2. Test your QR Codes
Check that your QR Codes operate properly before bulk dissemination.
Best Practice: Test the QR Codes on numerous devices and scanner apps.
3. Optimize landing pages for mobile
Why: Most people will scan QR Codes with their mobile devices, so make sure the mobile experience is smooth.
Best Practice: Create mobile-friendly landing pages that load quickly and offer a smooth user experience.
4. Provide value and incentives
Why should people scan QR Codes? Offer value, such as discounts, exclusive material, or valuable information.
Best Practice: Make sure the material or offers underlying the QR Codes are useful and relevant to your target audience.
5. Use Dynamic QR Codes
Why: Dynamic QR Codes allow you to alter the destination URL without modifying the QR Code itself.
Best Practice: Use dynamic QR Codes to provide flexibility and refresh connected content as needed.
6. Keep track of QR Code placements
Why: The positioning of your QR Codes can influence their usefulness.
Best Practice: Strategically install QR Codes in high-traffic areas so that they are easily accessible and visible.
For example, a gym may post QR Codes near the entrance and on popular equipment to maximize visibility.
I. FAQs
1. How should the QR Code be linked to Google Analytics?
A dynamic QR Code can be linked to Google Analytics in two ways. Generate a unique tracking URL using UTM parameters.
Using Scanova’s QR Code generator, generate a URL QR Code from the link with the UTM parameters.
After entering the URL, one can change the QR Code. It is possible to download, test, and save the code.
Check Google Analytics —> Acquisition —> Campaigns —> All Campaigns to see if analytics data is being collected.
2. How do I track a QR Code for analytics?
To track an analytics QR Code, distribute the QR Code across various channels. When users scan the QR Code, Google Analytics captures data such as scan location, time, device, and referral source.
Track the data within the designated Property or through UTM parameter tracking in Google Analytics to analyze user engagement and campaign performance.
3. Is it possible to check the number of times a QR Code is scanned?
You can check the total number of QR Code scans and the number of distinct users who have scanned your code using dynamic QR Code analytics.
Summing Up
QR Codes bridge the gap between offline and online, but when paired with Google Analytics, they become a powerful engine for data-driven decisions.
Whether you’re running print ads, event promotions, or packaging campaigns, tracking scan data helps you understand what’s working and where to improve.
With Scanova, setting up this integration is fast, simple, and privacy-compliant. You’ll gain full visibility into your scan traffic and finally connect your physical marketing efforts to digital performance.
Ready to make every scan count? Try Scanova’s QR Code Analytics with Google Analytics today.
