QR Code Tracking & Analytics
Track the scanning activity of your Dynamic QR Codes with Scanova's QR tracker
to understand user engagement and optimize strategies
Experience the power of analytics
Get a 360-degree view of scanning activity with Scanova's advanced QR Code tracking features
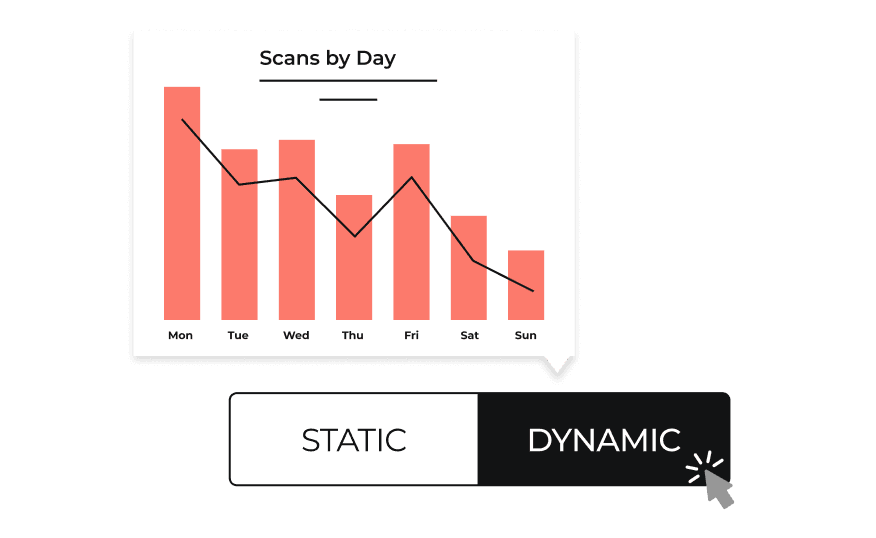
Easy setup
With just a few clicks, you can generate Dynamic QR Codes that not only direct users to specific content but also track scan activity. This feature eliminates the need for complex setups or coding, allowing businesses to quickly implement QR Codes into their strategies.
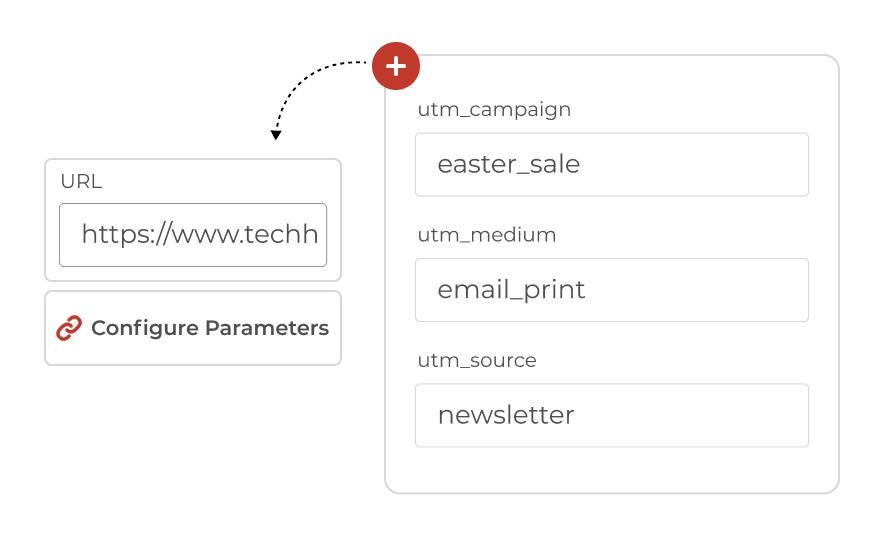
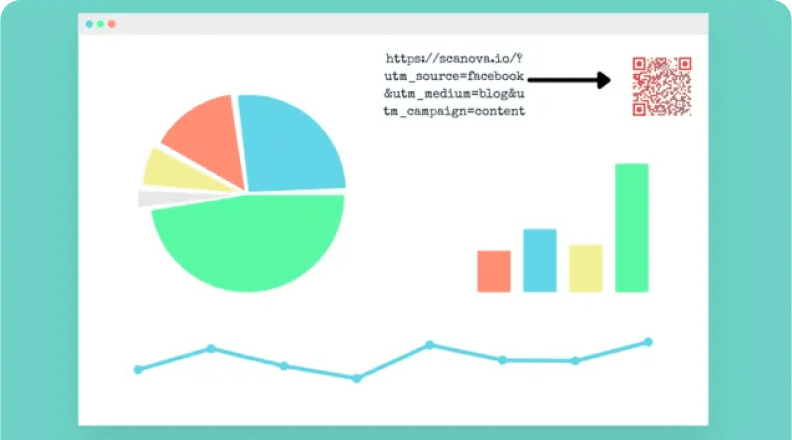
UTM Parameters for Tracking
UTM parameters are tags you can add to your URLs that allow you to track the exact source, medium, campaign, content, and search terms associated with the QR Code traffic. By embedding these parameters, you can see in your analytics tools—like Google Analytics—which QR Code placements or marketing materials are driving traffic and conversions.
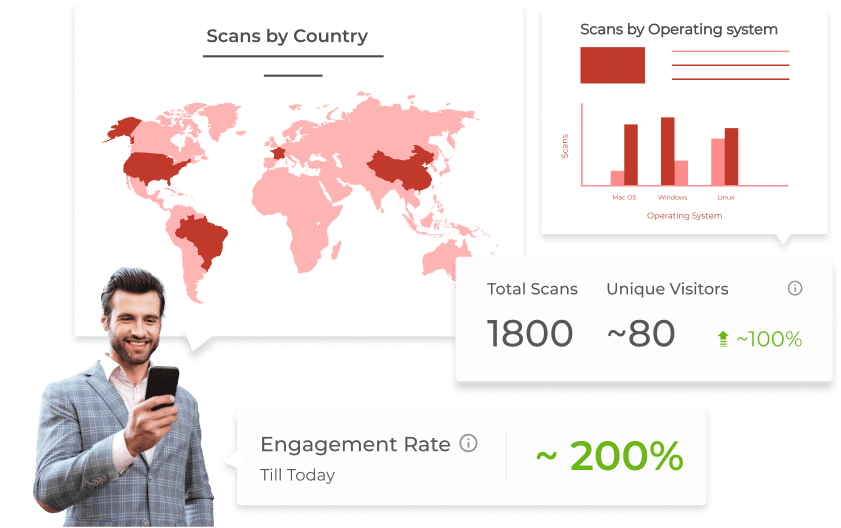
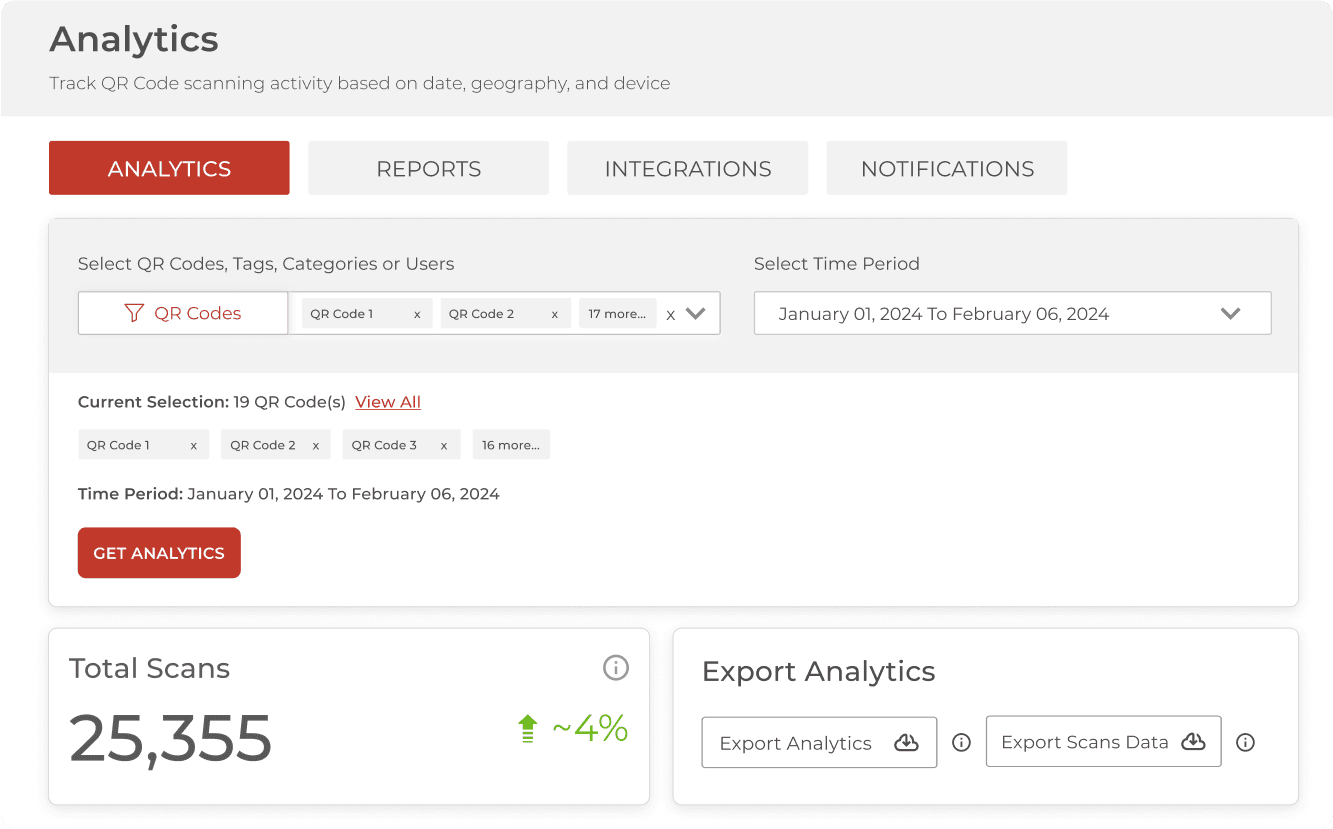
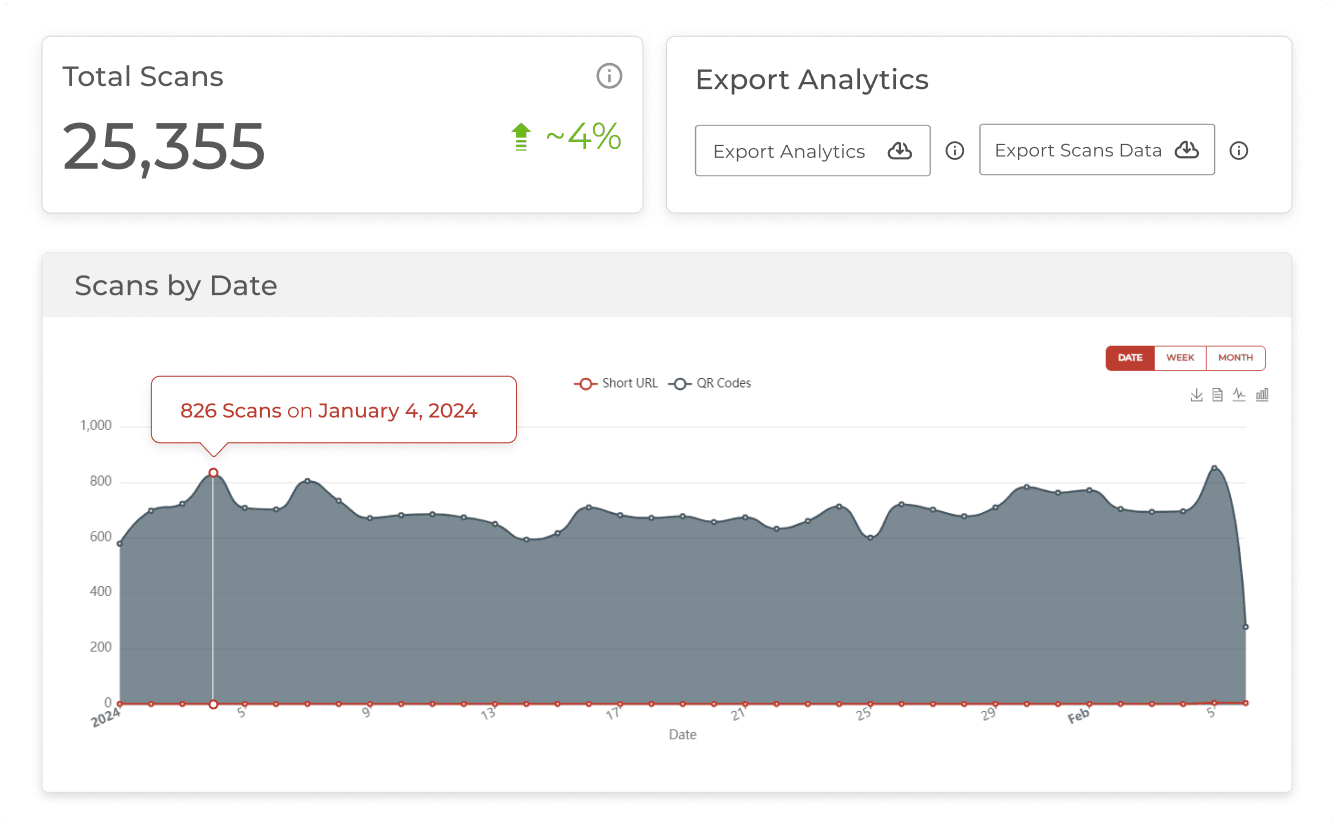
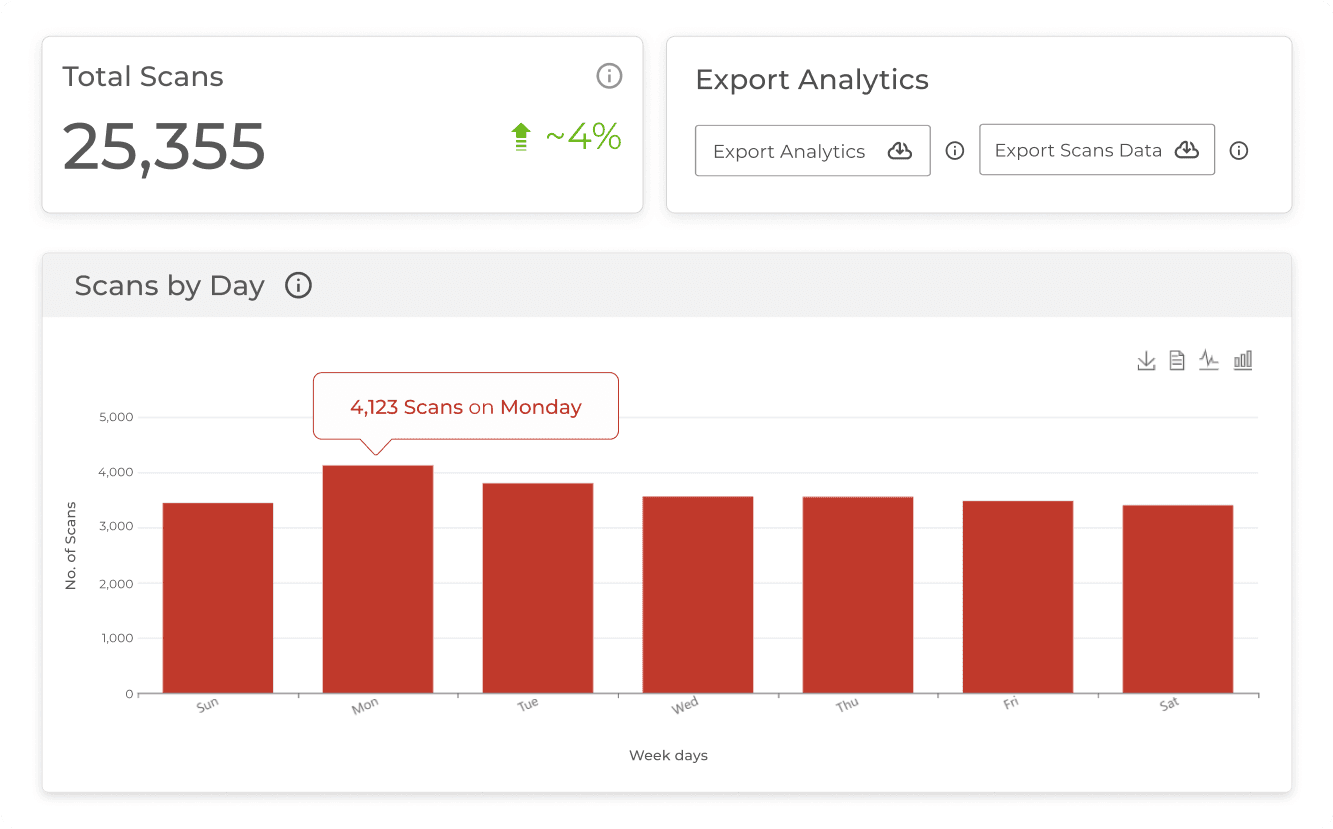
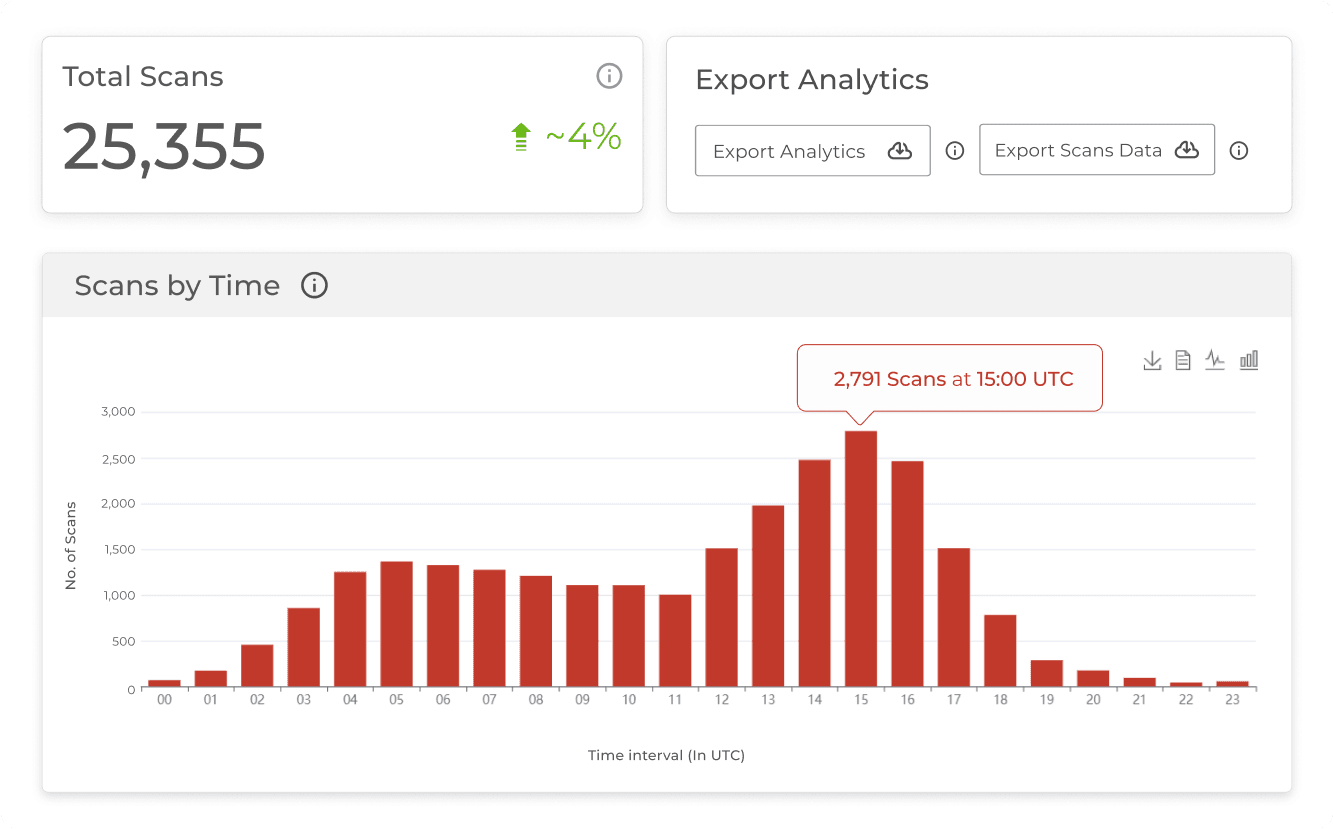
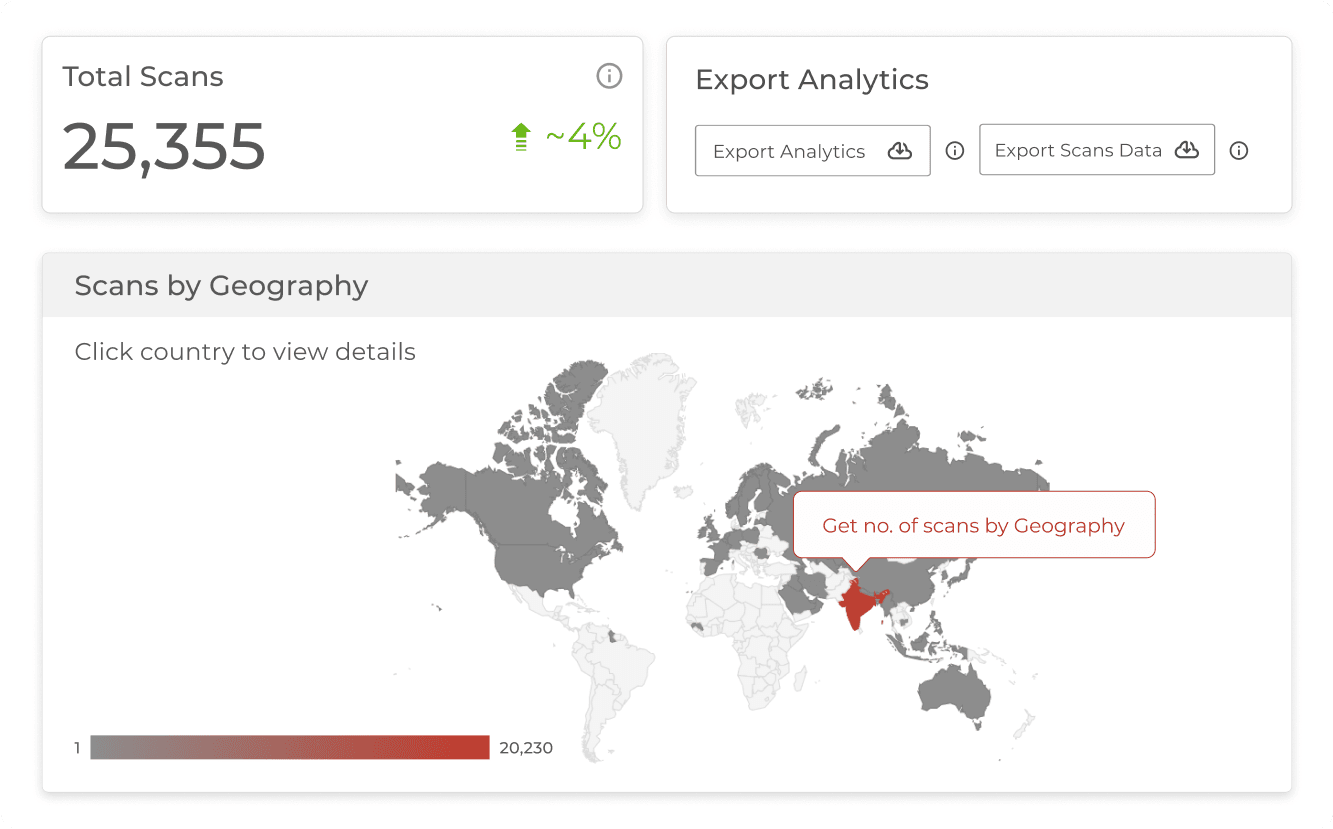
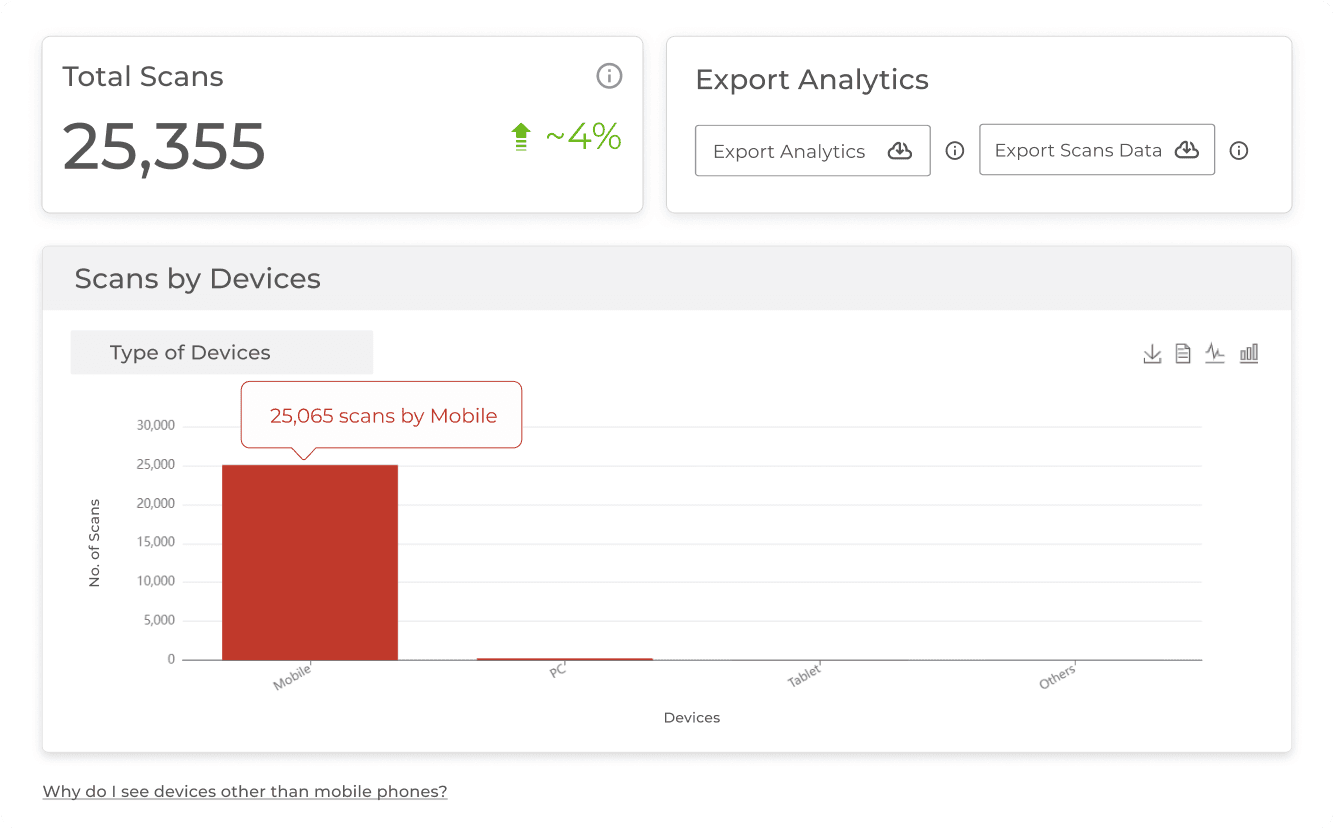
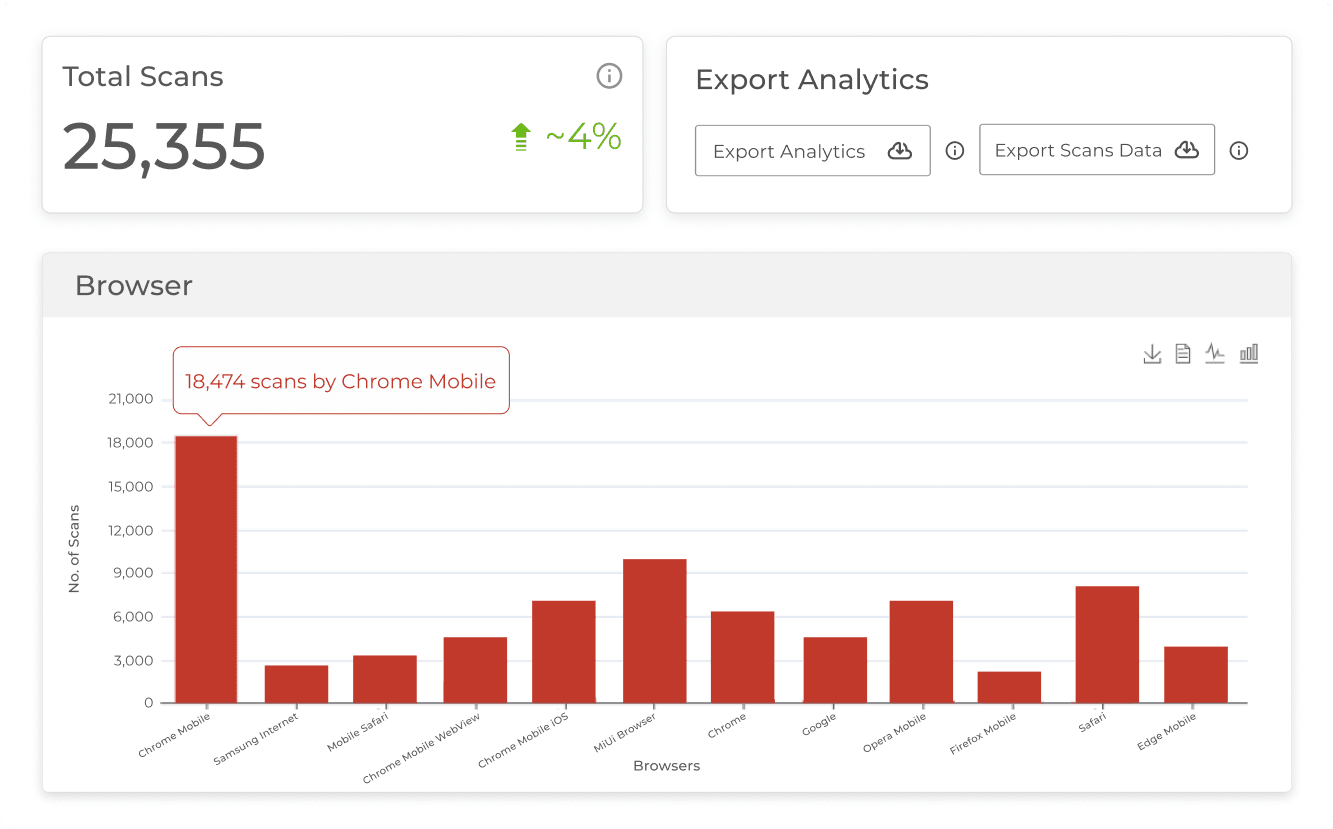
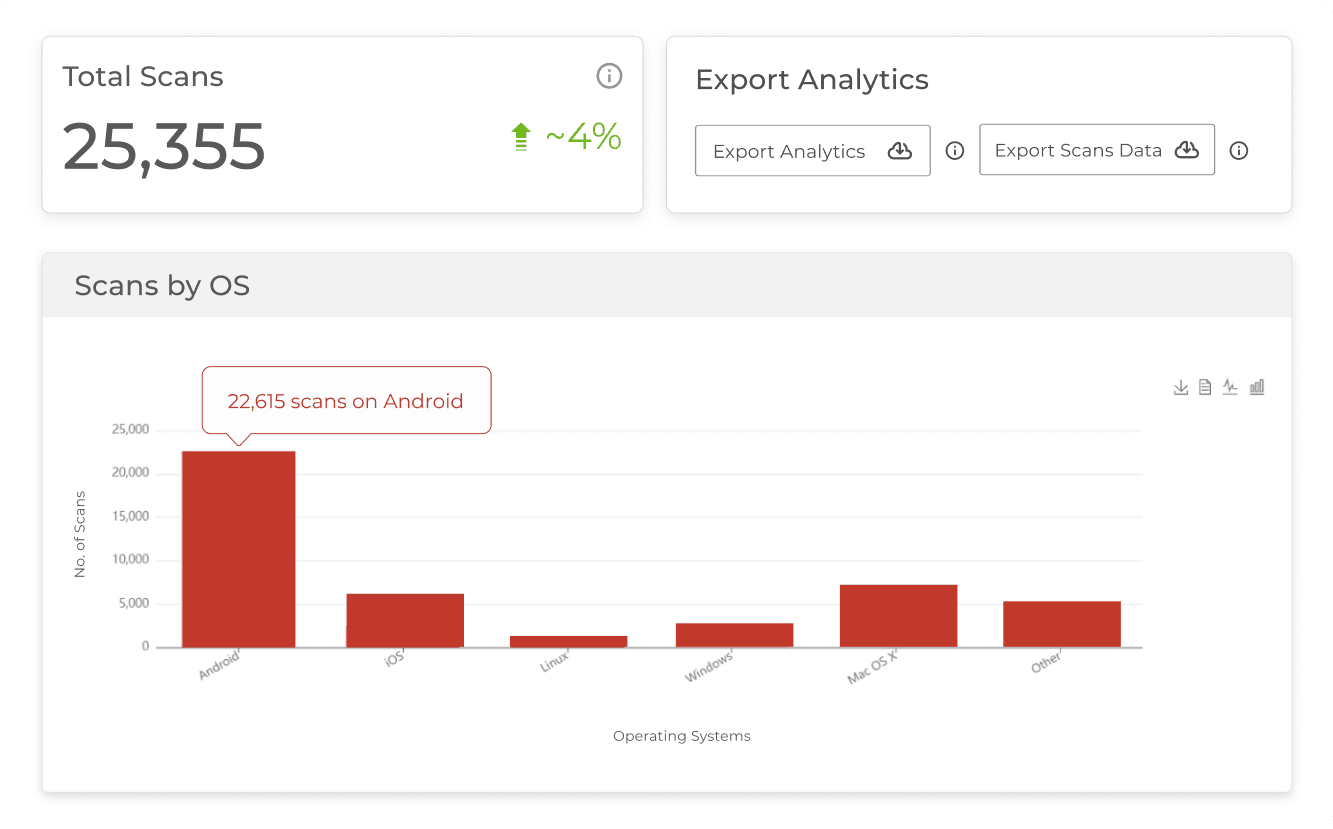
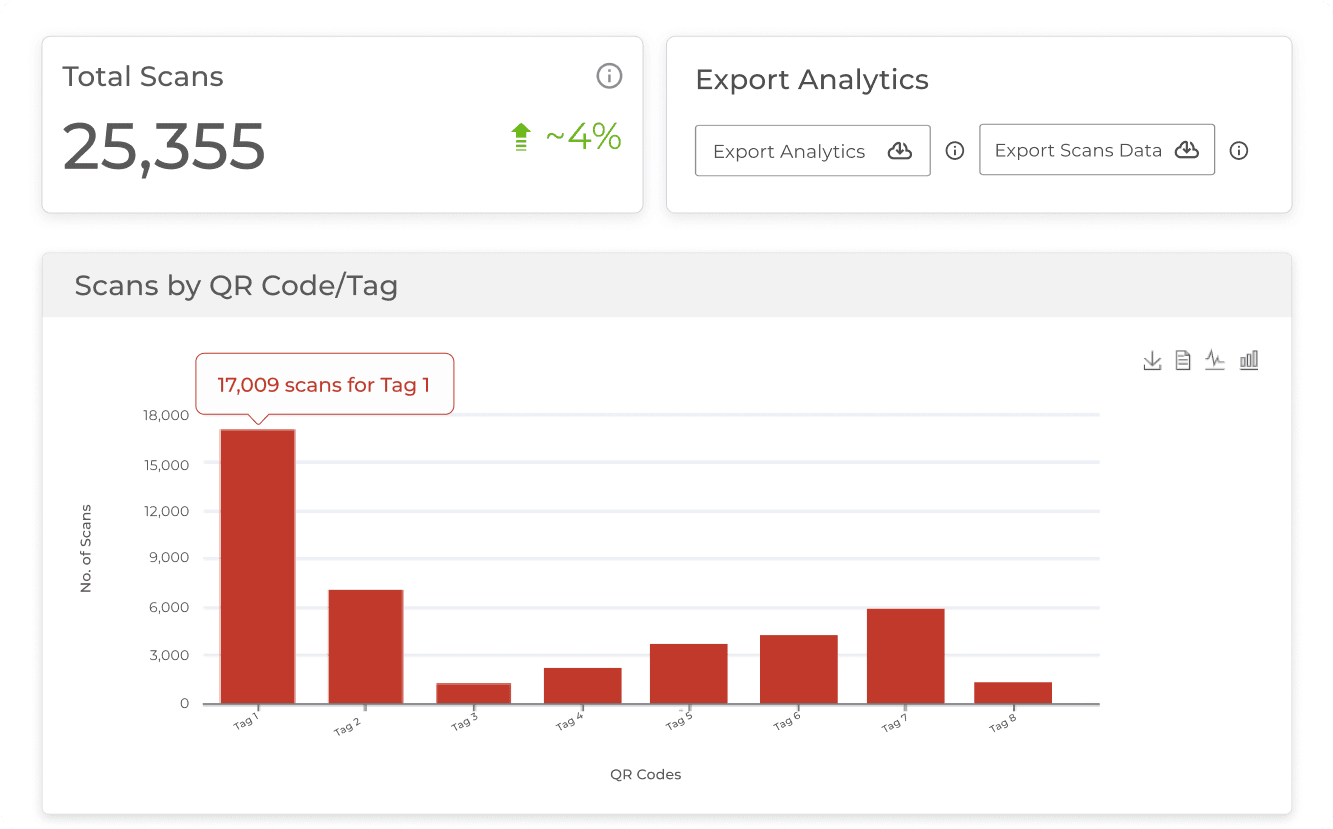
Monitor the scans on your QR Code & more
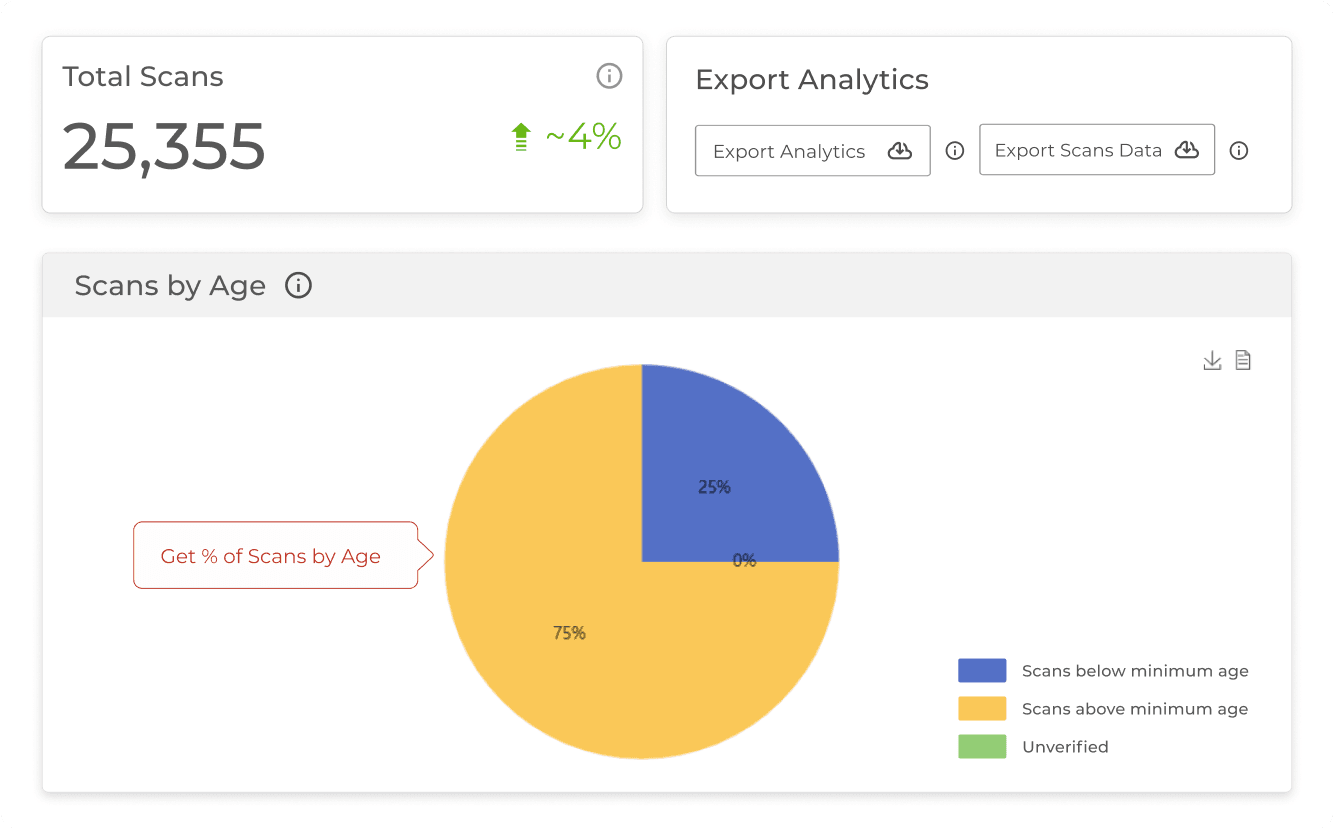
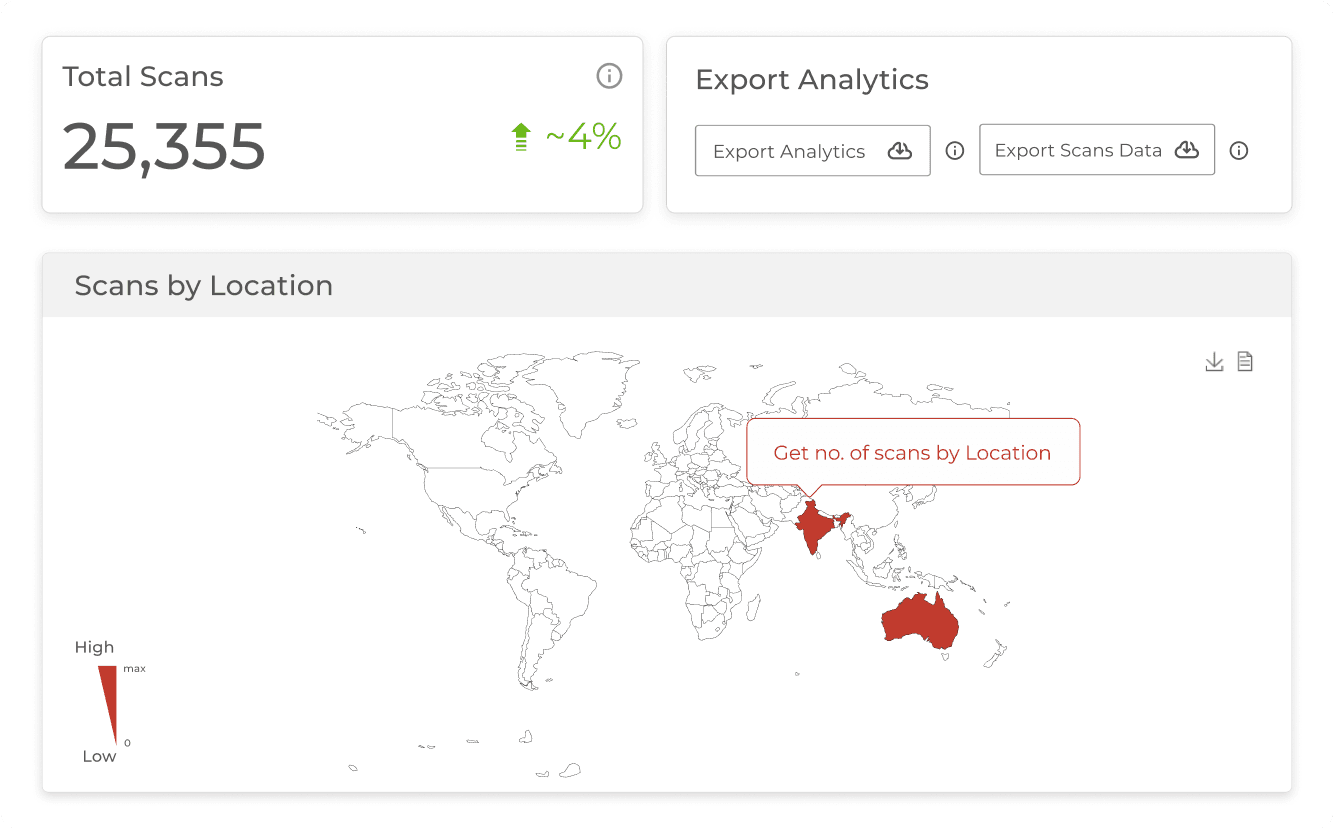
Gain in-depth insights into your QR Code performance with detailed analytics. Get data on the number of scans by date, day, time, city, country, type of device, browser, operating system, and handset. This helps you gauge the effectiveness of your campaigns and allows for targeted marketing strategies.
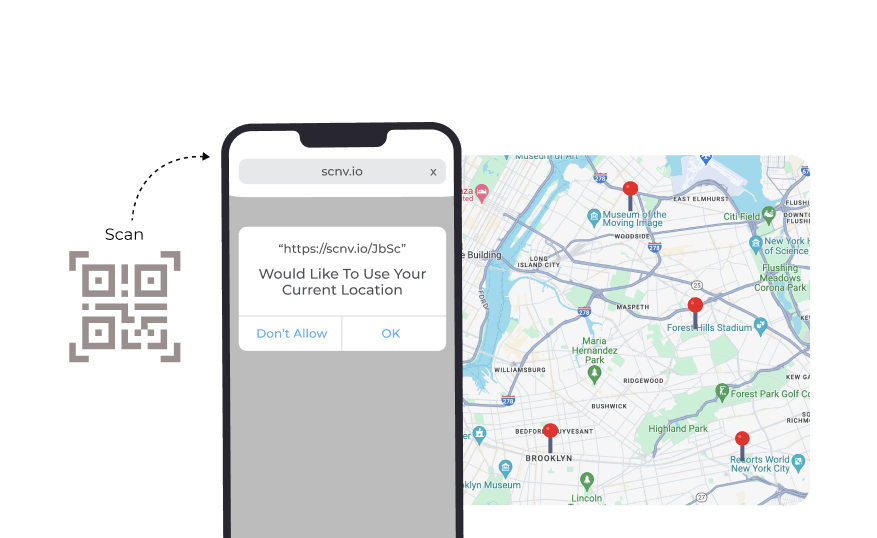
Track scans by exact GPS location
With user's permission, get the exact GPS location of each scanning device. Understand where users are engaging with your QR Codes, enabling targeted marketing efforts. Analyzing scan activity across different regions, helping to identify high-interest areas for future campaigns.
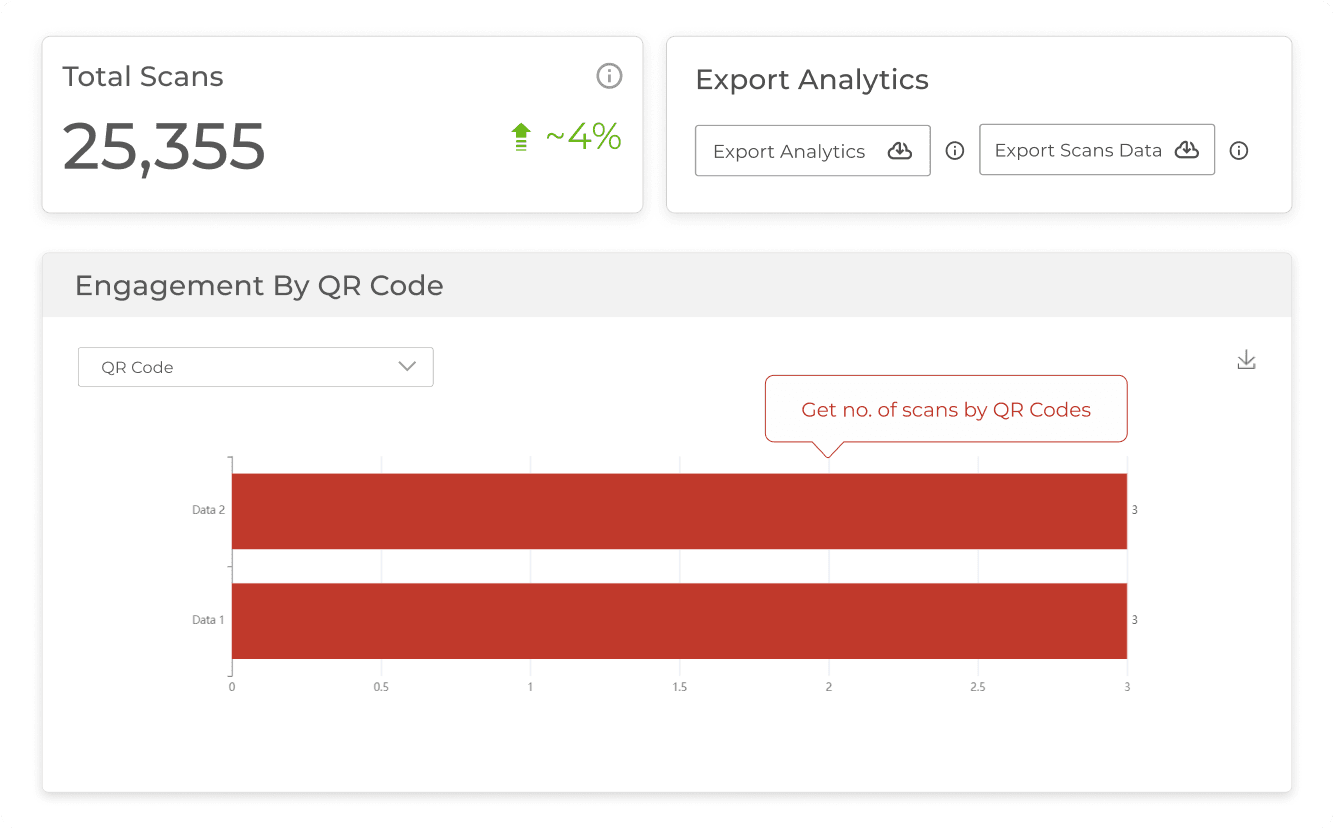
Event tracking
Utilize this feature to monitor clicks and engagement rates for actionable elements like buttons, as well as for various landing pages such as custom pages, product pages, business card profiles, and pages comprising social media links. This comprehensive tracking enables you to optimize your campaigns.
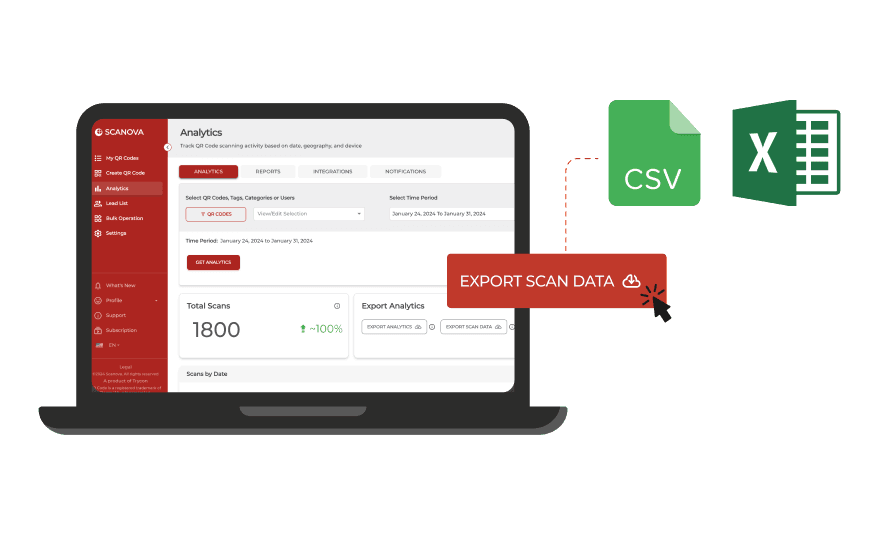
Export scans data
Exporting your scan data is simple and efficient. You can download aggregate or detailed scan-level data in CSV or Excel formats. These detailed reports can be shared with stakeholders to demonstrate campaign effectiveness and inform decisions.
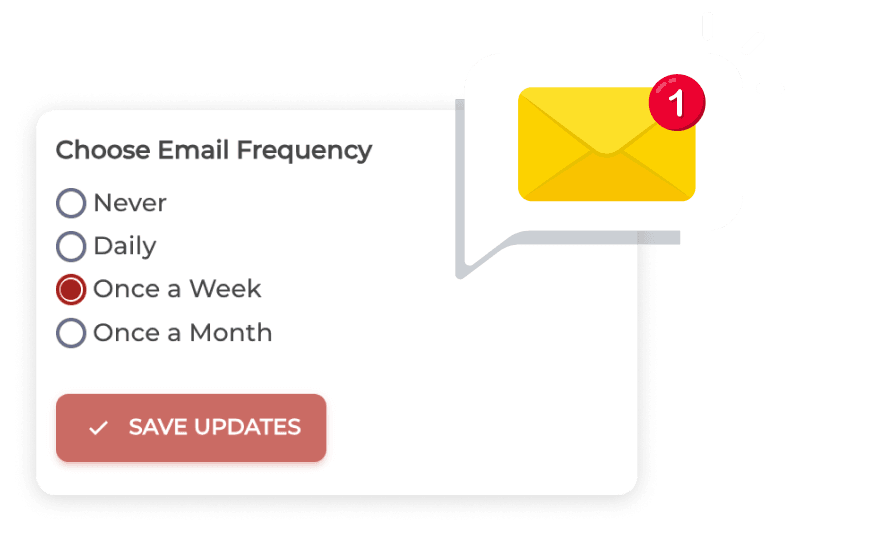
Notifications
Receive analytics data directly in your email inbox through scheduled reports. This feature ensures you are always updated on your QR Code performance without needing to log into the dashboard constantly. Regular notifications help in quickly adapting marketing strategies based on real-time data insights.
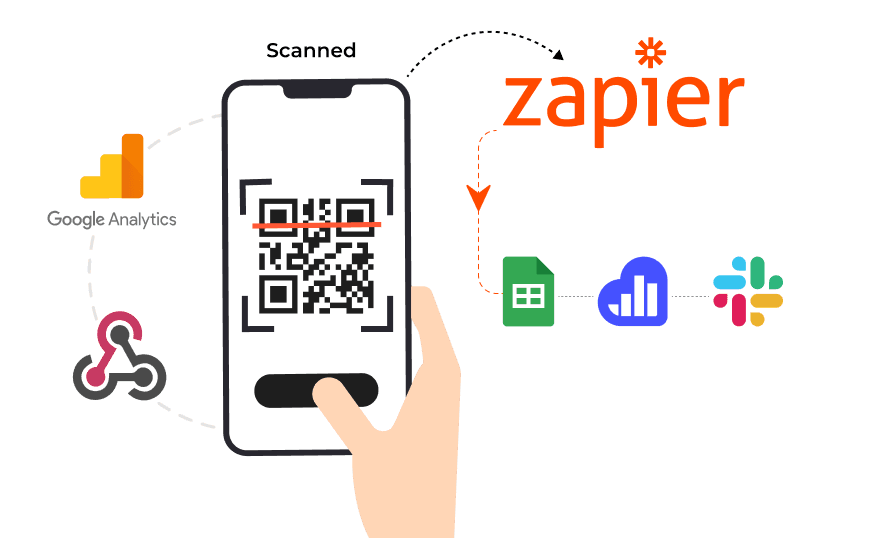
Seamless integration
Get all your analytics data in one place with either Google Analytics or Webhooks integration. When a QR Code is scanned, you can use webhooks and an integration service provider like Zapier to send the scan data (date, time, location, etc.) to any compatible app such as Google Sheets, Kissmetrics, Slack, etc.
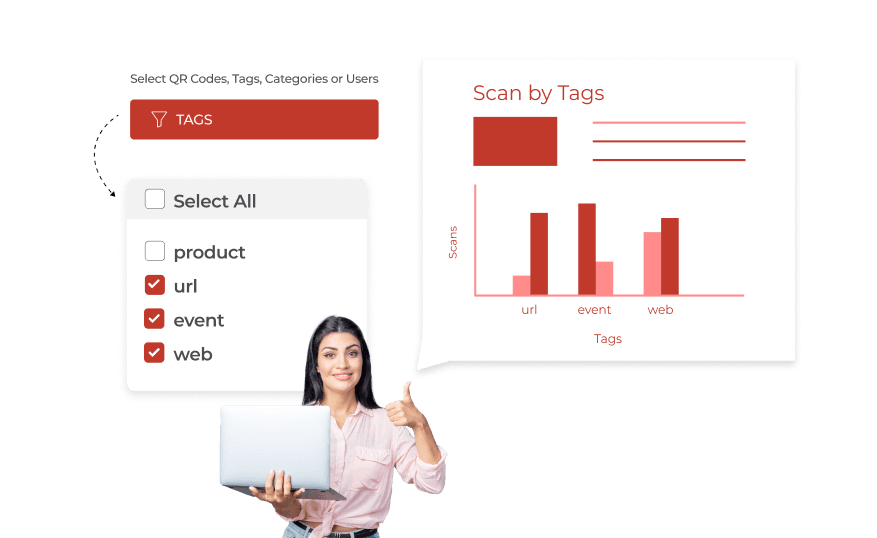
Tag-level analytics
Ensure proper classification with tags. Get report and analytics data at tag, user, and category levels. Analyze performance based on specific tags assigned to each code. Gain deeper insights into user engagement at various levels, helping refine strategies tailored to different demographics or product lines.
End-user tracking
Enabling this option only maps data recorded via different features with the end-user's permission. It allows you to link a unique tracking ID across multiple features such as scan tracking & analytics, lead generation, custom form, and exact GPS location.
Gain valuable insights with real-time analytics
Get a detailed overview of your campaign’s performance
Scanova is trusted by brands like Amazon, AT&T, and Walmart


98% of QR Codes created are dynamic and trackable
Scanova’s internal data underscores the increasing need of real-time tracking
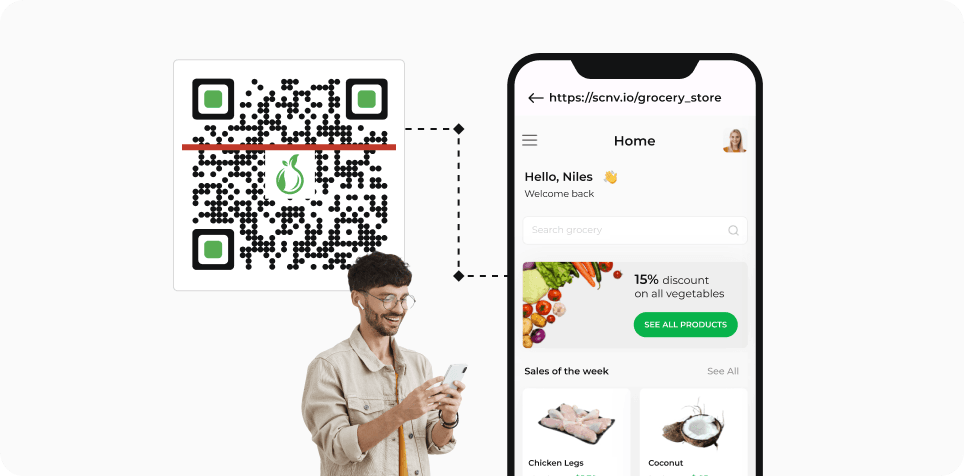
Retail
Dynamic QR Codes enable retail businesses to engage customers by redirecting them to promotional content, product information, or loyalty programs. By tracking scan data, retailers can analyze customer behavior and optimize marketing strategies—enhancing customer experience.
Dynamic QR Codes enable retail businesses to engage customers by redirecting them to promotional content, product information, or loyalty programs. By tracking scan data, retailers can analyze customer behavior and optimize marketing strategies—enhancing customer experience.
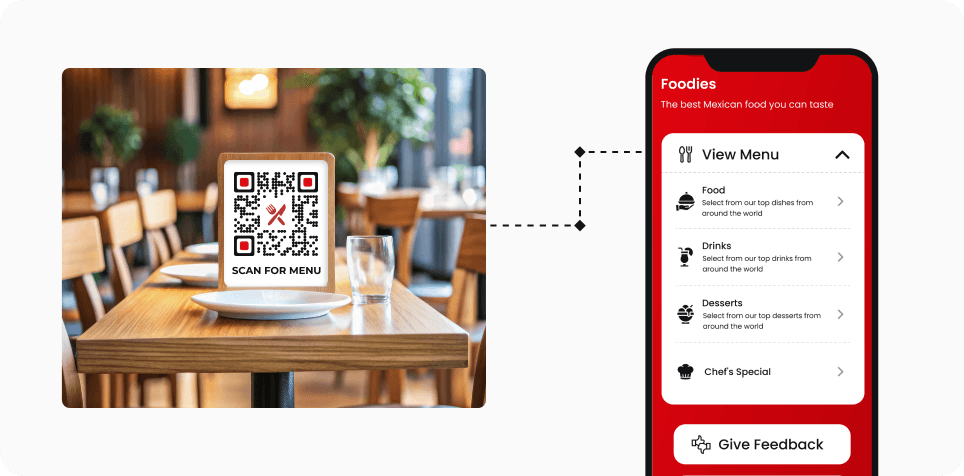
Hospitality
Dynamic QR Codes streamline menu access and the ordering process. Restaurants can update their menus instantly without reprinting codes, while analytics provide insights into guest engagement—allowing restaurants to actively work on improving guest experience.
Dynamic QR Codes streamline menu access and the ordering process. Restaurants can update their menus instantly without reprinting codes, while analytics provide insights into guest engagement—allowing restaurants to actively work on improving guest experience.
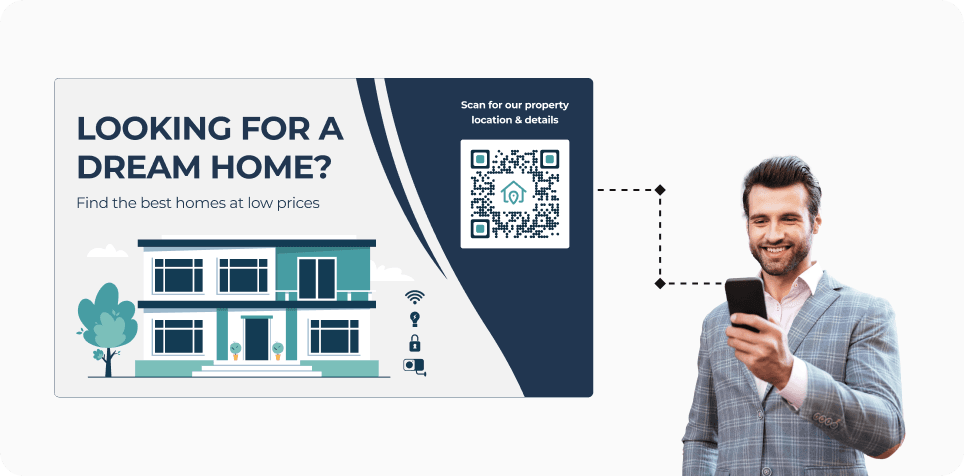
Real Estate
Real estate agents use Dynamic QR Codes to provide potential buyers with instant access to virtual tours and detailed property information. The tracking feature allows agents to gauge interest levels in specific properties, helping them tailor their listings.
Real estate agents use Dynamic QR Codes to provide potential buyers with instant access to virtual tours and detailed property information. The tracking feature allows agents to gauge interest levels in specific properties, helping them tailor their listings.
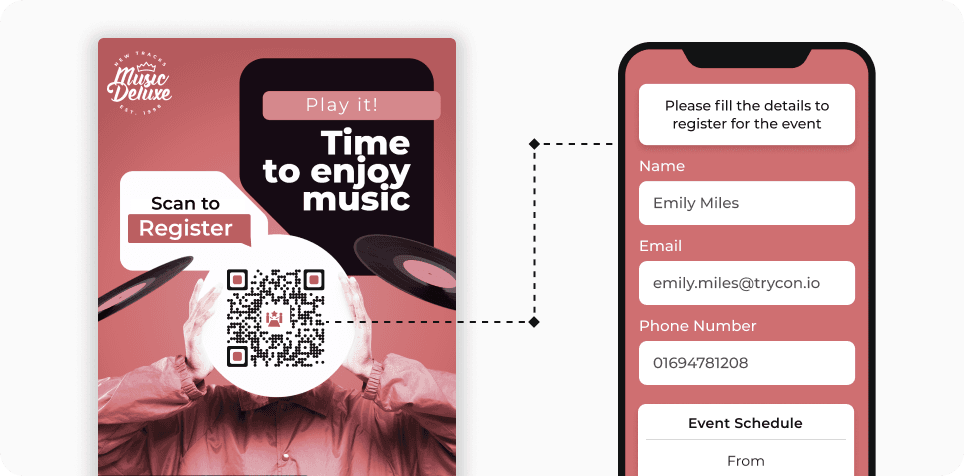
Event Management
Event organizers use Dynamic QR Codes for sharing event and ticketing information. These codes can link to schedules or speaker bios that can be updated as needed. Tracking scans helps organizers understand attendee interests and optimize future events.
Event organizers use Dynamic QR Codes for sharing event and ticketing information. These codes can link to schedules or speaker bios that can be updated as needed. Tracking scans helps organizers understand attendee interests and optimize future events.

Product Packaging
Brands are incorporating Dynamic QR Codes on packaging to provide consumers with additional product information, such as usage instructions or sustainability practices. The ability to track scans allows companies to measure consumer interest in specific features or promotions.
Brands are incorporating Dynamic QR Codes on packaging to provide consumers with additional product information, such as usage instructions or sustainability practices. The ability to track scans allows companies to measure consumer interest in specific features or promotions.
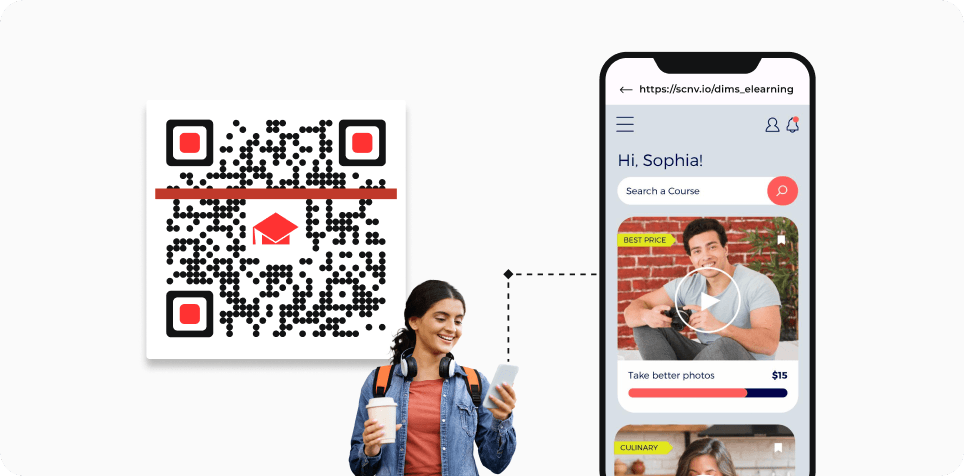
Education
In educational settings, Dynamic QR Codes can be used for sharing detailed course materials. Analytics allow educators to monitor student engagement with resources, helping them identify which materials are most effective and where additional support may be needed.
In educational settings, Dynamic QR Codes can be used for sharing detailed course materials. Analytics allow educators to monitor student engagement with resources, helping them identify which materials are most effective and where additional support may be needed.
Get desired results for your business with Scanova’s Dynamic QR Generator
Best brands in the world trust Scanova QR Code Generator
 Caitlyn DuffyLarge Format Sales District Leader, PepsiCo
“The simplicity of this tool makes it easy for even non-tech users”
Easy to use and achieve successful outcomes with Scanova. The simplicity of this tool makes it easy for even non-tech users. Scanova solves the concern of tracking websites and data sheets efficiently.
 David TaitPerformance Media Lead, Yourtown
“Scanova helps us quickly create QR Codes for multiple uses”
A quick and easy tool for QR Codes. The different QR Code types and features available, including the ability to customize a QR Code based on brand requirements, are impressive. It enables the team to access, manage, create, and download their QR Codes easily. Scanova helps us quickly create QR Codes for multiple uses.
 Daniela GutierrezCDW National Business Leader, Hitachi Vantara
"We have increased our leads by 10x with Scanova"
Scanova has been a wonderful addition to our marketing toolkit. It helps us boost lead generation easily. By introducing Scanova QR Codes in our keynote presentations and booths at conferences, we have increased our leads by 10x. Scanova also makes it easy to customize lead forms, presenting a slick view back to the end user.
 Mojtaba AbediExecutive Director, Finance Maxim Ltd.
“Scanova has proven to be an invaluable tool for our events and projects”
I am quite satisfied with Scanova's services and appreciate their effort in enhancing user experience. Scanova has proven to be an invaluable tool for our events and projects. The ease of use and the range of features have significantly contributed to the success of our initiatives. I particularly appreciate the efficiency of Scanova’s team—always ready to assist.
 Marie ZeccaAdvisory Board Chair, Colorado Women's Lacrosse Officials Association (CWLOA)
“Scanova allows us to gauge interest in multiple distribution areas”
We love that Scanova provides us with demographics/location information when we use their QR Codes in a magazine ad. This allows us to gauge interest in multiple distribution areas. Scanova allows us to access data that we can directly correlate with other analytics we have to help deliver customers with a more accurate ROI on the service.
 Muthaian PrakashDirector—Digital Technology and Solutions, Olam Information Services Private Limited
“The tool has easy-to-use templates for quick implementation”
A perfect QR Code Generator for Dynamic QR Codes. The best part of Scanova is its useful options to generate Dynamic QR Codes with brand identity by adding logos, brand colors, and more. Also, the tool has easy-to-use templates for quick implementation. We have printed Dynamic QR Codes in our consumer package products in the healthy snacks category.
 Brian MarshVP Operations, I DJ NOW
“I highly recommend Scanova”
We use Scanova for our brochures and catalogs as the pricing keeps changing. It’s terrific to send our clients to our website with an easy scan. We have also used Scanova on marketing postcards and backdrops for our booth at trade shows. We love looking at the analytics reports to see how many users visited our site or a webpage. I highly recommend Scanova.
Your security and privacy are important to us
Experience exceptional data protection with ISO/IEC 27001:2022, GDPR, and SOC2 compliance


Frequently Asked Questions
Get quick answers related to Scanova’s trackable QR Codes
How can I track the performance of my QR Codes?
Scanova QR Code Generator with tracking feature helps you track the performance of your codes. You can track your QR Codes by monitoring metrics such as the number of scans, scan locations, device types, and engagement rates through detailed analytics. Additionally, with UTM parameters, you can also track the exact source, medium, and campaign details of your QR Code traffic in analytics platforms like Google Analytics, enabling deeper insights into which channels and campaigns are driving results.
How does GPS tracking work with QR Code scans?
With user permission, you can access the exact GPS location of each scanning device. This feature allows for precise location tracking of user interactions.
Is it possible to export my QR Code scan data?
Yes, you can export both aggregate and detailed scan-level data in CSV or Excel formats for efficient analysis and reporting.
Can I track user engagement on my landing pages using QR Codes?
Yes. You can monitor clicks and engagement rates for actionable elements like buttons on various landing pages—including custom pages, product pages, business card profiles, and social media links.
How will I receive analytics updates about my QR Codes?
You can set up regular reports to be sent directly to your email inbox, providing you with timely insights for informed decision-making and strategic planning. You can select an email frequency of your choice daily, once a week, or once a month.
Discover how to use Scanova's tracking and analytics feature for your campaigns


Unleash the full potential of Scanova
Enhance efficiency with Scanova’s powerful QR Code analytics features