QR Code Reporting: How to Track and Report Every Scan

In a nutshell (TL;DR): QR Code reporting helps turn scan data into actionable insights by showing how your QR Code campaigns perform over time. Only dynamic QR Codes can be tracked, as static QR Codes cannot collect scan data after printing. A detailed report includes metrics like total scans, unique scans, scan trends, locations, devices, and conversions. To set up reporting, create a dynamic QR Code, add UTM tags, test it, launch your campaign, monitor results, and schedule reports. Scanova’s QR Code Tracking & Analytics provides real-time dashboards, email reports, CSV and Excel exports, and GA4 integration for deeper campaign analysis.
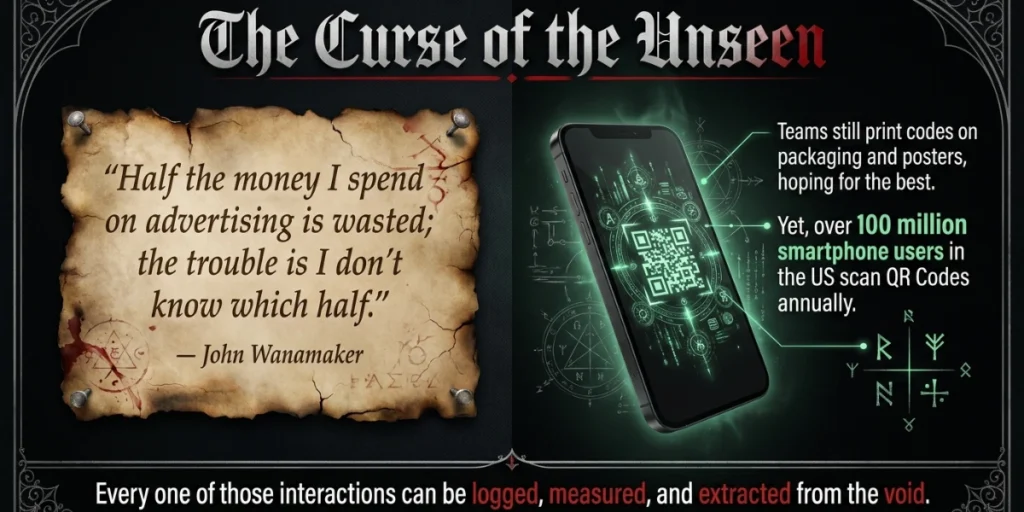
“Half the money I spend on advertising is wasted; the trouble is I don’t know which half.” That famous line is credited to retail pioneer John Wanamaker, as Forbes notes.
He said it over a century ago. Yet many marketing teams still live with the same problem today. They print QR Codes on packaging, posters, menus, and mailers. Then they hope for the best.
Here is the good news. QR Codes are one of the few print tools you can measure like a digital channel.
According to eMarketer data published on Statista, more than 100 million smartphone users in the US now scan QR Codes each year. Every one of those scans can be logged, measured, and reported.
That is what QR Code reporting is all about. In this guide, I will explain what QR Code reporting means, how scan tracking works, which metrics matter, and how to build reports your team will actually read.
I work on this every day at Scanova, so I will also share what we have learned from the scan data on our own platform.
A. What is QR Code reporting?
QR Code reporting is the process of collecting scan data and turning it into clear, shareable reports. These reports show how many people scanned your QR Codes, where they scanned, when they scanned, and on which devices. Teams use them to judge campaign performance and plan the next move.
It helps to separate three terms that often get mixed up:
- QR Code tracking is the act of logging each scan event. Every scan of a trackable QR Code creates a data record.
- QR Code analytics is the layer that organizes this data. Think of dashboards, charts, and maps. We covered this in depth in our guide to QR Code analytics.
- QR Code reporting is the final step. It packages the data into a format people can act on. That could be a weekly email digest, a CSV export, or a slide for your monthly review.
Tracking collects. Analytics organizes. Reporting communicates. Most teams do the first two and skip the third. That is a mistake. Data that never reaches a decision maker might as well not exist.
B. Why does QR Code reporting matter?
QR Code reporting matters because it turns print marketing into a measurable channel. Without reports, you cannot tell which poster, package, or mailer drives results. With them, you can compare placements, prove ROI, and cut spend on what doesn’t work.
Here is what good reporting lets you do:
- Prove offline ROI. A scan is a hard data point. Reports let you tie print spend to real engagement, and even to sales.
- Compare placements. Did the QR Code on the shelf talker beat the one on the flyer? A report answers this in seconds.
- Catch problems early. A sudden drop in scans can signal a broken landing page or a poorly placed print run.
- Justify the budget. Clear numbers make budget talks easier. “This campaign drove 4,000 scans and 300 sign-ups,” beats “we think it did well.”
- Learn about your audience. Location and device data reveal where and how people engage with your brand.
There is also a wider gap to close here. In our own QR Code statistics report, we found that Website URL QR Codes account for roughly two-thirds of all QR Codes generated on our platform in the US.
That means most QR Codes point to web pages. Yet many of the teams behind them never connect scan data to what happens on those pages. Reporting closes that loop.
We have seen this work at scale. AutoZone, a leading auto parts retailer, used our scan-tracking and analytics to streamline operations and improve the customer experience across its stores. You can read the full story in our AutoZone case study.
C. How does QR Code tracking actually work?
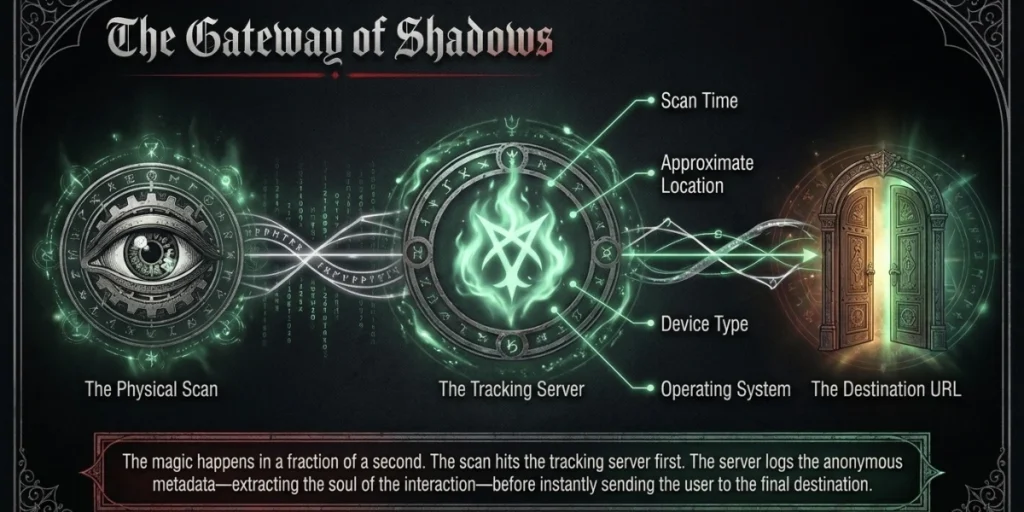
QR Code tracking works through a redirect. A dynamic QR Code does not store your final link inside the pattern. It stores a short redirect URL instead.
When someone scans it, the request first hits a tracking server. The server logs the scan, then sends the user to your destination. This whole step takes a fraction of a second.
That logged record is what powers every report. It typically includes the scan time, approximate location, device type, and operating system.
Static QR Codes work differently. They encode the final link directly into the pattern. The scan goes straight to the destination, so there is no step where data can be logged. This is why the static vs dynamic choice matters so much.
|
Feature |
Static QR Code |
Dynamic QR Code |
|
Scan tracking |
Not possible |
Built in |
|
Edit destination after printing |
No |
Yes |
|
Reporting and exports |
No |
Yes |
|
Best for |
One-off personal use |
Campaigns and business use |
One important note on privacy. Scan tracking logs anonymously and aggregate data such as city-level locations and device types.
It does not identify the person scanning. Still, if you collect any personal data after the scan, such as a form entry, you should disclose how you will use it.
If you want the full technical breakdown, our dynamic QR Code generator page explains how the redirect layer works in practice.
D. Which metrics should your QR Code report include?

A useful QR Code report includes six core metrics: total scans, unique scans, scans over time, scan location, device type, and conversions. Together, these answer the three questions every stakeholder asks. How many? Who and where? And did it work?
|
Metric |
What does it tell you |
Why it matters |
|
Total scans |
How many times has your QR Code been scanned |
Measures overall reach and visibility |
|
Unique scans |
How many individual devices were scanned |
Separates real audience size from repeat scans |
|
Scans over time |
Daily, weekly, or monthly scan trends |
Shows campaign momentum and peak times |
|
Scan location |
Country and city-level scan data |
Reveals which regions engage most |
|
Device and OS |
iOS vs Android, phone models |
Helps you optimize the landing page |
|
Conversions |
Actions taken after the scan |
Ties scans to sign-ups, leads, or sales |
The first five come straight from your QR Code dashboard. The sixth, conversions, is where most teams fall short. A scan is a click, not a result. If your report stops at scan counts, you are reporting activity, not outcomes.
“A scan tells you the print placement worked. A conversion tells you the campaign worked. Effective QR Code reporting needs both to understand the complete customer journey.” – Siddharth Pangtey, Product Manager, Scanova
So, how do you measure conversions from a QR Code? Two ways. First, use a landing page with a clear action, such as a form, coupon, or purchase link. Second, pass UTM tags through the QR Code so tools like Google Analytics 4 can attribute the result. We will cover both below.
E. How do you set up QR Code reporting?

You can set up complete QR Code reporting in under an hour. Here is the process we recommend to every team that starts with us.
Step 1: Open your preferred browser and go to Scanova
Open any browser you like, such as Chrome, Safari, Firefox, or Edge. Scanova is a web-based tool, so there is nothing to download or install. In the address bar, type scanova.io and press Enter.
Step 2: Log in to your Scanova account
Click Login if you already have an account. If you are new, sign up first. It only takes a minute. This step matters more than it looks. Every QR Code you create with a Scanova account is dynamic by default. That means scan tracking is built in from the very first scan. A static QR Code, on the other hand, can never track anything once printed.
Step 3: Select your QR Code category
Click Create QR Code and choose the content type you need. For most campaigns, this is Website URL, which sends people to a landing page when they scan. Pick the category that matches your goal before moving ahead.
Step 4: Prepare your link with UTM parameters
Before you paste your landing page link, add UTM parameters. These are short tags at the end of a URL. They tell your analytics tools exactly where each visit came from. Use Google’s free Campaign URL Builder and fill in three fields:
- utm_source: the placement, such as “poster” or “packaging”
- utm_medium: set this to “qr_code”
- utm_campaign: the campaign name, such as “spring_launch”
The tool gives you a tagged URL. Copy it. With these tags in place, QR traffic shows up as its own channel in your web analytics.
Step 5: Enter your link and name your QR Code
Paste the tagged URL into the destination field. Then give your QR Code a clear name, such as “Spring Launch – Store Poster”. Good naming pays off later. When you have ten campaigns running, clear names make your reports easy to read.
Step 6: Customize the design
You can keep the standard black-and-white design or create a custom one. Add your logo, change the colors, or match your brand style. A branded QR Code looks more trustworthy and tends to invite more scans. One rule: always keep a strong contrast between the QR Code and its background so it stays easy to scan.
Step 7: Download the QR Code in your preferred format
Download your QR Code in the format your design team needs. Use PNG or JPG for digital use. Use a vector format such as SVG, EPS, or PDF for print, since vectors stay sharp at any size, from a sticker to a billboard.
Step 8: Test the QR Code on real devices
Never send a QR Code to print without a full test. Scan it with an iPhone and an Android device. Confirm the landing page loads fast and looks right on a mobile screen. Printing errors are expensive and often permanent, so this two-minute check is worth it every time.
Step 9: Confirm your test scans in the dashboard
Open your Scanova dashboard and check that your test scans were logged. This confirms tracking is working end-to-end. One small tip: note how many test scans you made. You can subtract them later so your campaign numbers stay clean.
Step 10: Launch and watch the dashboard daily
Once your campaign is live, scan data starts flowing in real time. In the first week, check the dashboard every day. Look at when people scan, where they scan from, and which devices they use. Early data can flag placement problems while there is still time to fix them. If a busy location shows almost no scans, the QR Code may be too small, too high, or poorly lit.
Step 11: Schedule reports and export your data
Do not rely on memory to check the numbers. Set up a reporting rhythm instead. In Scanova, you can schedule analytics reports to be delivered to your inbox regularly. You can also export scan data as CSV or Excel files. Choose a summary export for quick team updates, or a detailed export for deeper analysis.
Step 12: Review, compare, and act
A report is only useful if it changes what you do next. After every campaign, compare results across placements and designs. Retire the placements that do not perform. Double down on the ones that do.
Then set a baseline so your next campaign has a clear target to beat. Repeat this loop, and QR Code reporting becomes a system that keeps improving your results.
F. How do you track QR Code scans in Google Analytics 4?
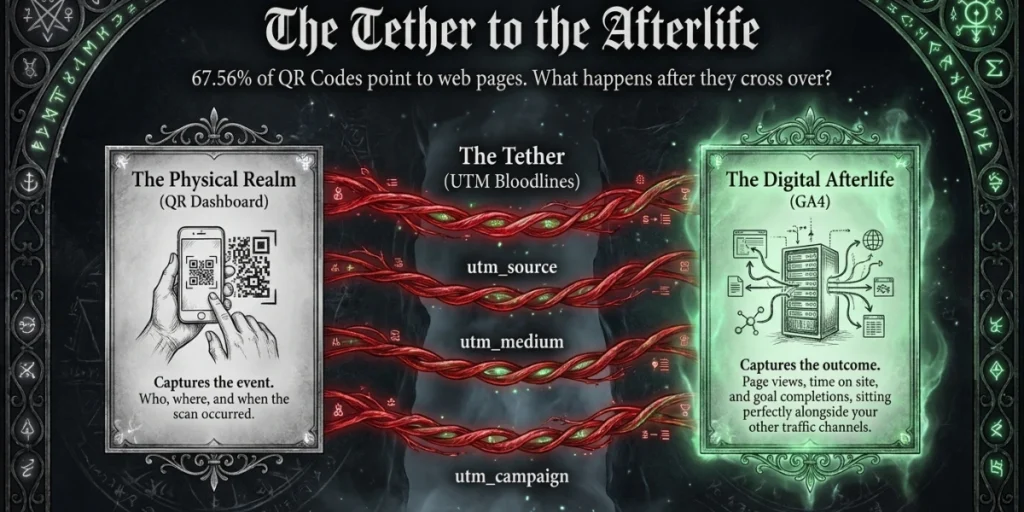
You track QR Code scans in Google Analytics 4 by adding UTM parameters to the QR Code’s destination URL.
Once tagged, GA4 records each scan visit as a session with a known source and medium. No extra code is needed on your site beyond the standard GA4 setup.
Here is where to find the data. In GA4, open Reports, then Acquisition, then Traffic Acquisition. Filter the report by your UTM values, such as medium=”qr_code”.
You will now see sessions, engagement, and conversions that came from your QR Codes, right next to your other channels.
Keep in mind what each tool is best at. Your QR Code dashboard captures the scan itself: the time, place, and device. GA4 captures what happens after the scan: page views, time on page, and goal completions.
Neither replaces the other. Used together, they give you the full journey from print to purchase.
You can also link the two directly. Scanova supports GA4 integration, so scan data flows into the analytics setup your team already uses.
For teams with custom needs, webhooks can push scan events to other tools as they happen.
G. How do you share QR Code reports with your team?

The best way to share QR Code reports is to match the format to the audience. Executives want a short summary with trends. Marketers want campaign comparisons. Analysts want raw data they can slice themselves.
Here are the four formats that cover almost every case:
- Scheduled email reports. A recurring email digest keeps stakeholders informed without requiring anyone to log in. This works well for leadership updates. Scanova lets you schedule these directly from your account.
- CSV and Excel exports. Raw scan data is best for analysts and finance teams. Export it, then pivot by campaign, region, or time period as needed.
- Live dashboards. For teams that manage many QR Codes, a shared dashboard beats static files. Everyone sees the same real-time numbers.
- Automated pushes via webhooks. Scan events can flow into Slack, Google Sheets, or a CRM the moment they happen. This suits sales teams that need to act on scans fast.
Whatever format you pick, keep the report itself simple. Lead with the outcome, such as scans and conversions against the goal. Follow with one insight, such as the best-performing placement.
End with one action for the next period. A report that fits on one screen gets read. A twelve-page export does not.
H. What are the most common QR Code reporting mistakes?

The most common QR Code reporting mistake is printing a static QR Code and expecting scan data later. It cannot be done. Here are the five mistakes we see most often, and how to avoid each one.
- Printing static QR Codes. Static QR Codes cannot log scans, and there is no fix after printing. Always use dynamic QR Codes for any campaign you want to measure.
- Skipping UTM tags. Without UTM parameters, QR traffic is hidden within “direct” traffic in your web analytics. You lose the ability to attribute results. Tag every destination URL before the QR Code goes live.
- Reporting activity instead of outcomes. Scan counts alone do not prove value. Pair every scan number with a conversion number, even if the conversion is as simple as a coupon claim.
- Having no baseline or goal. A report that says “2,000 scans” means nothing on its own. Is that good? Set a target before launch, or use your last campaign as the baseline.
- Staying silent on data use. If your QR Code leads to a form, tell people how their data will be used. Clear disclosure builds trust and improves completion rates.
Avoid these five, and your reports will already be ahead of most QR Code campaigns in the market.
I. FAQs: QR Code Reporting
1. Can you track a QR Code after it has been printed?
Only if it were created as a dynamic QR Code. Dynamic QR Codes route scans through a tracking layer, so every scan is logged even after printing. Static QR Codes skip that layer, and tracking cannot be added to them later.
2. Are QR Code scans anonymous?
Yes, in standard scan tracking. Platforms log aggregate data such as scan time, city-level location, and device type. They do not identify the individual. Personal data comes into play only if the user submits it after the scan, for example, via a lead form.
3. Do free QR Code generators include reporting?
Usually not in full. Most free tools create static QR Codes, which cannot be tracked at all. Scan tracking, dashboards, and scheduled reports are typically part of paid plans on dedicated platforms. Check for dynamic QR Code support before you commit.
4. What is a good scan rate for a QR Code campaign?
There is no single benchmark that fits all campaigns. Scan rates vary widely by placement, industry, audience, and offer. The reliable approach is to set your own baseline. Run one campaign, record the results, and measure every later campaign against it.
5. Can QR Code scan data feed into Google Analytics?
Yes. Add UTM parameters to the QR Code’s destination URL, and GA4 will record each scan visit with its source and medium. Some platforms, including Scanova, also offer direct GA4 integration and webhooks for real-time data flows.
Conclusion
QR Code reporting turns print marketing from a guessing game into a measured channel. The formula is simple. Use dynamic QR Codes so every scan is logged. Tag your links so results can be attributed. Track the six core metrics. Then share short, clear reports on a schedule your team can rely on.
Wanamaker never learned which half of his ad spend was wasted. With QR Code reporting, you can know exactly which poster, package, or page earns its keep.
If you want to see this in action, explore how Scanova’s QR Code Tracking & Analytics works. You can create a dynamic QR Code, run a small test campaign, and have your first scan report in your inbox this week.