QR Code Location Tracking: How It Works

In a nutshell (TL;DR): QR Code location tracking records where every scan happens. A dynamic QR Code logs the scanner’s city and country through their IP address by default. With the user’s permission, it can also capture the exact GPS position of the scan. In this guide, we explain how both methods work, how to set them up, what privacy laws require, and what 69.9 million scans taught us about acting on location data.
Yes, a QR Code can tell you where it was scanned. Every campaign we run at Scanova produces a live map of scans by country, city, and even exact coordinates. That map is what scan location data gives you.
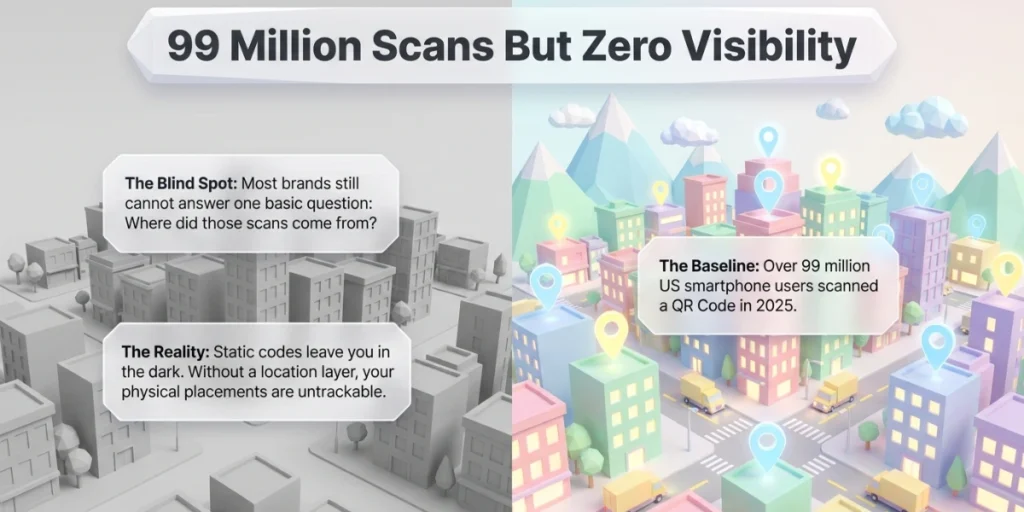
The audience is already scanning. More than 99 million smartphone users in the US scanned a QR Code in 2025, according to eMarketer data published on Statista. Yet most brands still cannot answer one basic question: where those scans came from?
This guide fixes that. We will cover how scan locations get captured and how IP tracking differs from GPS tracking. We will also cover the consent rules that keep it legal, a five-minute setup, and the plays that turn raw scan maps into revenue.
A. What is QR Code location tracking?
QR Code location tracking means recording where each scan of your code happens. When someone scans a dynamic QR Code, the short link behind it logs the request, including its source. Your dashboard then shows the results as a map and a city-by-city report.
Here is the key detail most articles skip. The tracking never lives inside the printed square. It lives in the link.
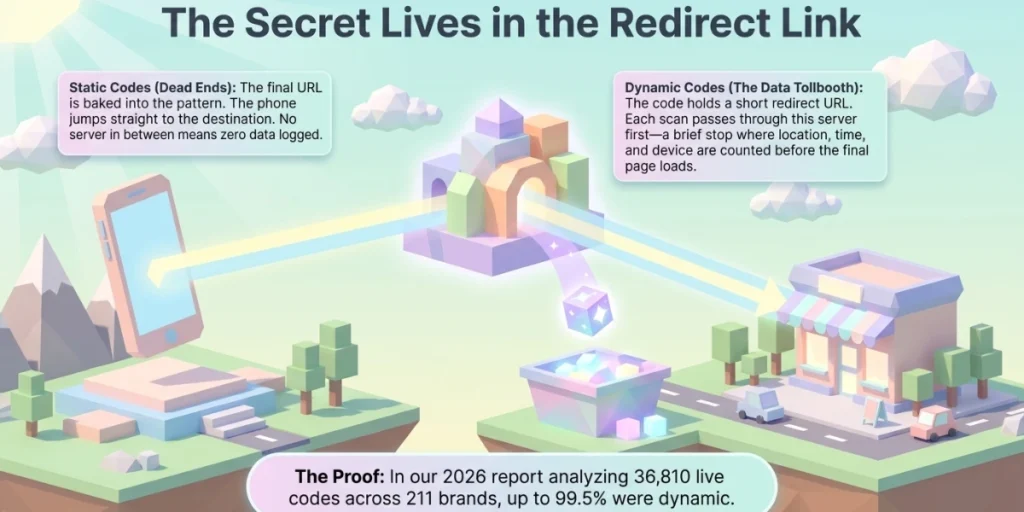
A static QR Code has the final URL baked into its pattern. The phone decodes it and jumps straight to the destination. No server sits in between, so nothing gets logged. A dynamic QR Code works differently. It holds a short redirect URL that you control.
Each scan passes through that redirect first. That brief stop is where the scan gets counted, timed, and located. We break down this mechanic fully in our guide on whether QR Codes can be tracked.
The market has already voted on this. For our 2026 QR Code Performance Report, we analyzed 36,810 live codes across 211 brands. Between 94.6% and 99.5% of them were dynamic. The static codes in the dataset recorded no scan activity we could measure. If you want location data, dynamic is the only route.
Location is one part of a bigger record. Each scan also logs the date, time, device type, and browser used. You see total scans and unique scans side by side. Location is the layer that turns those numbers into a map you can act on.
B. How do QR Codes capture location data?
QR Codes capture location in two ways: IP-based tracking and GPS-based tracking. IP tracking is automatic and shows the scanner’s city. GPS tracking is opt-in and shows the exact spot.
1. IP-based tracking (the default)
Every device on the internet carries an IP address. When a scan hits your redirect link, the server reads that address and matches it against a location database. You get the country, region, and city of the scan. No prompt appears, and the user does not need to do anything extra.
The trade-off is precision. IP data is reliable at the city level. But mobile networks can route traffic through hubs miles away. Treat it as a map of regional demand, not street-level truth.
2. GPS-based tracking (the precise option)
GPS tracking uses the phone’s own location hardware through the browser. The method follows the W3C Geolocation standard, the same one every website must use. Right after the scan, the page asks the user to share their location. If they tap Allow, you receive latitude and longitude, often accurate to within a few meters. If they decline, you still keep the IP-based city data as a fallback.
In Scanova, this is a single toggle. Enable exact GPS location capture in advanced settings, and permitted scans start appearing as pins on a map. Our full walkthrough of QR Codes for GPS location covers the dashboard views in detail.
Here is how the two methods compare:
|
Factor |
IP-based tracking |
GPS-based tracking |
|---|---|---|
|
Data you see |
Country, region, city |
Exact coordinates on a map |
|
User permission |
Not required |
Required, via browser prompt |
|
Accuracy |
City level |
A few meters, typically |
|
Coverage |
Every dynamic QR Code scan |
Only scans where users tap Allow |
|
Best for |
Regional trends, market comparison |
Placement-level insights, foot traffic |
A simple rule helps you choose. Use IP data when you compare markets, cities, or regions. Use GPS data when comparing physical locations, such as two entrances at the same mall. Most of our users run both. IP covers every scan, and GPS adds depth wherever people grant access.
C. Can a QR Code track your location without permission?
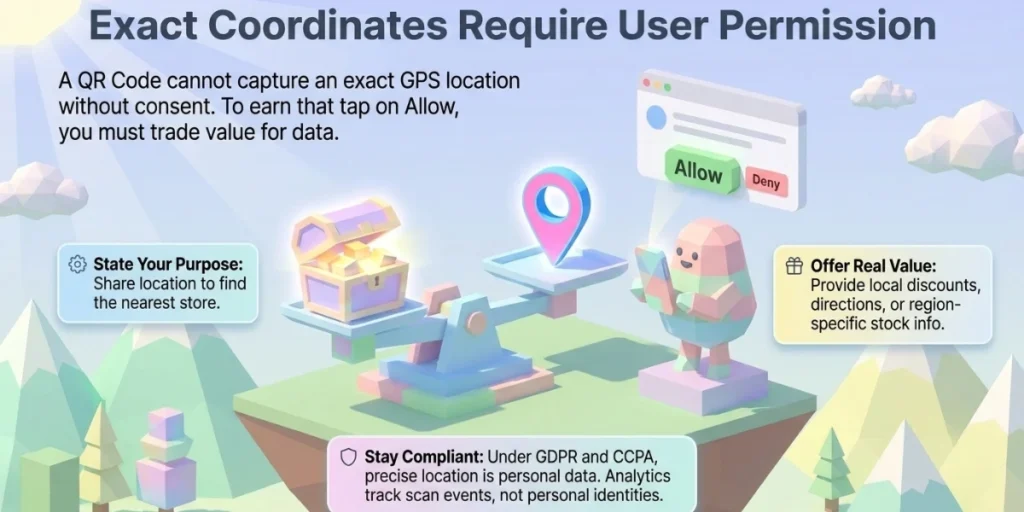
No. A QR Code cannot capture your exact location without your consent. Precise GPS data flows only after the scanner taps Allow on the browser prompt. IP-based data is collected on its own, but it only reveals a rough area, such as a city.
This question matters because your customers are asking it too. Scan hesitancy is real, and regulators have fed it.
Alvaro Puig, a consumer education specialist at the US Federal Trade Commission, warned in a 2023 consumer alert that “scammers hide harmful links in QR codes to steal personal information.” People who read warnings like that will not share their location with a brand they do not trust.
So earn the permission. Four habits we follow on every campaign:
- Say why you are asking. “Share your location to find the nearest store” converts far better than a bare prompt.
- Trade value for data. A local offer, directions, or region-specific stock info gives users a reason to tap Allow.
- Never gate the content. If someone declines, the page should still work. You keep the city-level data either way.
- Follow the law of the region you operate in. The GDPR treats precise location tied to a person as personal data. Collecting it needs a lawful basis, and consent is the usual one. US state laws, such as the CCPA, also give users rights over geolocation data. Loop in your legal team before launch.
Your privacy notice should be as clear as possible. State what location data you collect, why you collect it, how long you keep it, and how a user can opt out. A one-line link to that notice near the QR Code builds more trust than any design tweak.
One more reassurance worth passing to your audience: scan analytics describe scan events, not identities. Your dashboard shows that a code was scanned near a mall at 6 pm. It does not show who scanned it, their name, or their phone number.
D. How do you set up scan location tracking?
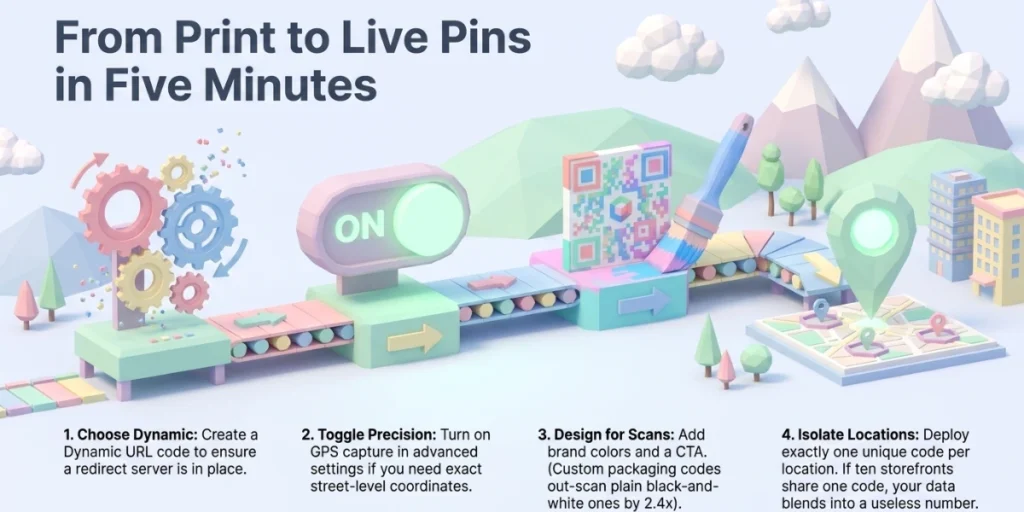
You can set up scan location tracking in about five minutes. Create a dynamic QR Code, switch on GPS capture if you need exact positions, and your dashboard starts mapping scans on its own. Here is the exact process we use:
- Log in to your Scanova account, or start the free trial, and click Create QR Code. Pick the category that fits your campaign. Website URL works for most cases, but you can also choose a landing page, a form, or a product page. Enter your destination link and click Continue.
- On the next screen, give your code a clear name and select Dynamic, not Static. This one choice is what makes tracking possible. Static codes cannot be tracked or edited once they are printed. Dynamic codes need an active plan, and the 14-day free trial covers you while you test.
- Turn on exact GPS capture if you need coordinates. Open the advanced settings under the Dynamic option and switch on exact GPS location. City-level tracking is already on by default, so skip this if city data is enough.
When exact GPS is on, each scanner is asked to share its location. People who allow it show up with precise coordinates. Everyone else still logs at the city level. Click Create QR Code when you are done. - Design the code. Add your logo, brand colors, and a clear call to action framed. Design is not vanity here. In our 2026 report, customized packaging codes out-scanned plain black-and-white ones by 2.4x at the median in CPG.
- Download the right format. Use SVG or EPS for print so the code stays sharp at any size. Use PNG for screens and email.
- Test before you print. Scan the code with two different phones. Then open your analytics and verify that the map logged your test scans in the correct location.
- Deploy one code per location. If ten storefronts share one code, their data blends into a single number you cannot use. Give every placement its own code, and name each one clearly before it goes to print.
Two small habits protect your data quality. First, keep a naming sheet that maps each code to its exact placement. Second, exclude your own test scans from reports, or run all tests before launch day. Clean inputs now save you from arguing with a messy map later.
Want to see the map fill in before you commit to the budget? Create one dynamic QR Code, place it at your busiest counter, and review the first week of scan data. That small test usually settles the debate on where the next ten codes should go.
E. What can you do with QR Code location data?
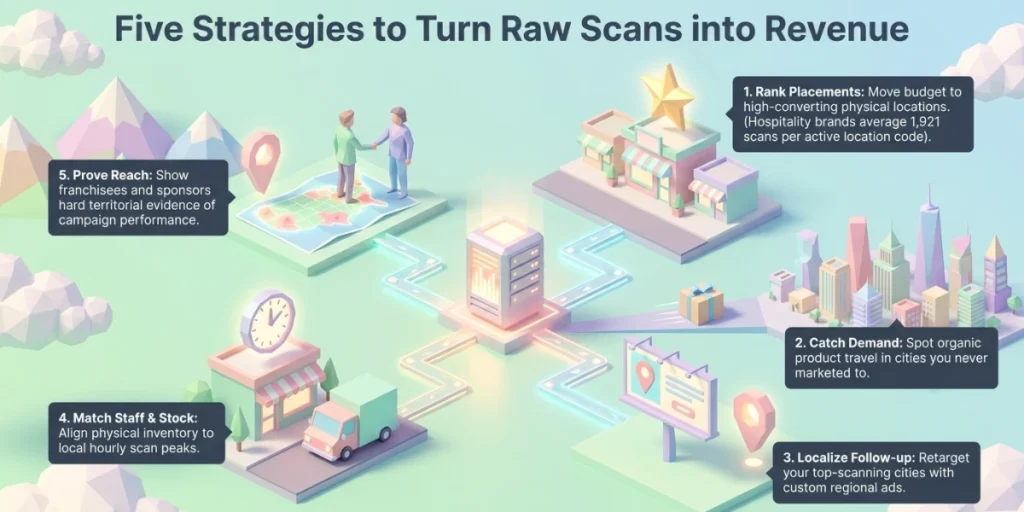
Location data tells you which placements earn attention and which markets want more. We use it to rank cities, fix weak placements, catch new demand, and prove campaign reach. Five plays deliver most of the value:
- Rank placements by conversion, not volume. A busy location can produce many scans and few actions. Divide conversions by scans for each placement, then move the budget to the efficient ones.
- Catch demand you never planned for. When a city you never marketed to keeps showing up in your scan map, that is a market signal. CPG teams use this to see where products actually travel after distribution.
- Localize the follow-up. Retarget your top-scanning cities with region-specific ads and offers. Some campaigns go further and serve different landing pages based on the scan’s region, so one printed code works across markets.
- Match staffing and stock to scan peaks. Scans by hour and city tell a restaurant when each branch gets busy, before queues form.
- Prove reach to partners. A scan map is hard evidence for franchisees, distributors, and sponsors that a campaign was performed in their territory.
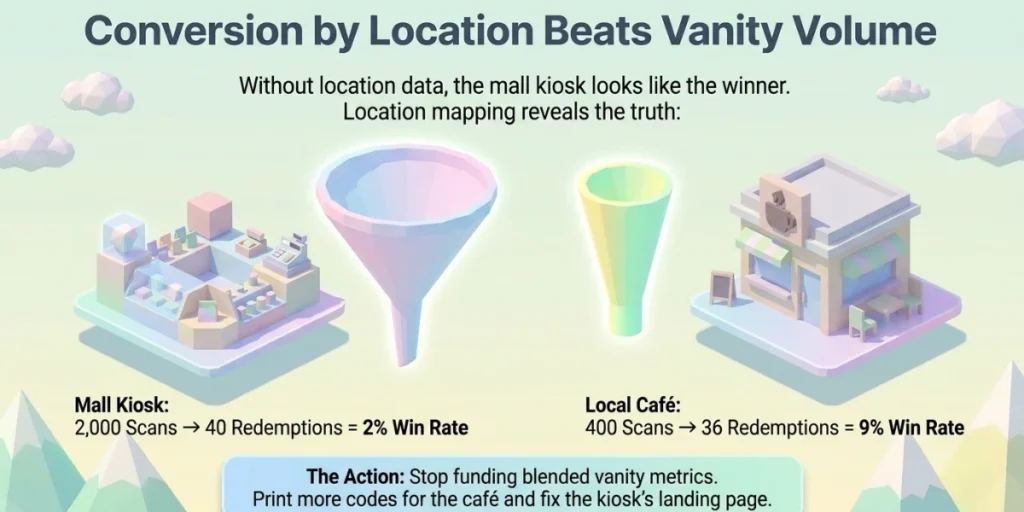
Here is the first play with real math. Say a mall kiosk code gets 2,000 scans and 40 coupon redemptions in a month. That is a 2% rate. A café counter code gets 400 scans and 36 redemptions. That is 9%.
The kiosk looks busier, but the café turns scanners into customers more than four times as often. Print more codes for the café. Fix the kiosk’s landing page. Without location-level data, both placements are hidden in a single blended number, and you fund the wrong one.
Our own data shows how much ground there is to gain. Across the 69.9 million scans in our 2026 report, hospitality brands used 10.9% of their QR Codes for location-based and map use cases, such as helping guests find a property or venue. Those codes averaged 1,921 scans per active code. Every one of those scans is a person standing in a specific location, telling you exactly where your signage works.
“One of the most common mistakes brands make with scan location data is treating it as a simple ranking of where scans happened. The real value comes from connecting location data with context, such as the campaign, placement, audience, and timing. The best-performing accounts use unique QR Codes for each location or touchpoint, so they can see not just where people scanned, but which physical experiences are actually driving engagement.” — Siddharth Pangtey, Product Manager at Scanova
F. Which metrics should you read with location data?
Location makes the most sense next to time, device, and repeat-scan data. Together, these four tell you where people scan, when they scan, what they scan with, and whether they come back.
- Time of scan by city. Peak hours differ across locations. Schedule staff, stock, and posts around each city’s own rhythm.
- Device and operating system. If one region skews heavily toward older Android devices, keep your landing page light and fast for it.
- Unique versus total scans. Many repeat scans from the same spot can indicate a loyal audience. It can also mean a confusing page that forces re-scans. The location column tells you where to go look.
- Permission grant rate. Scanova’s analytics show how many users granted location access. A low rate means your ask is not earning trust. Improve the prompt copy and the value exchange.
Pair all of this with your web analytics. Add UTM tags to the destination URL, and tools like GA4 will show what scanners did after they landed. Your QR dashboard stays the source of truth for the scan itself. Your web analytics take over from the click onward.
G. Where should you place your first tracked QR Code?
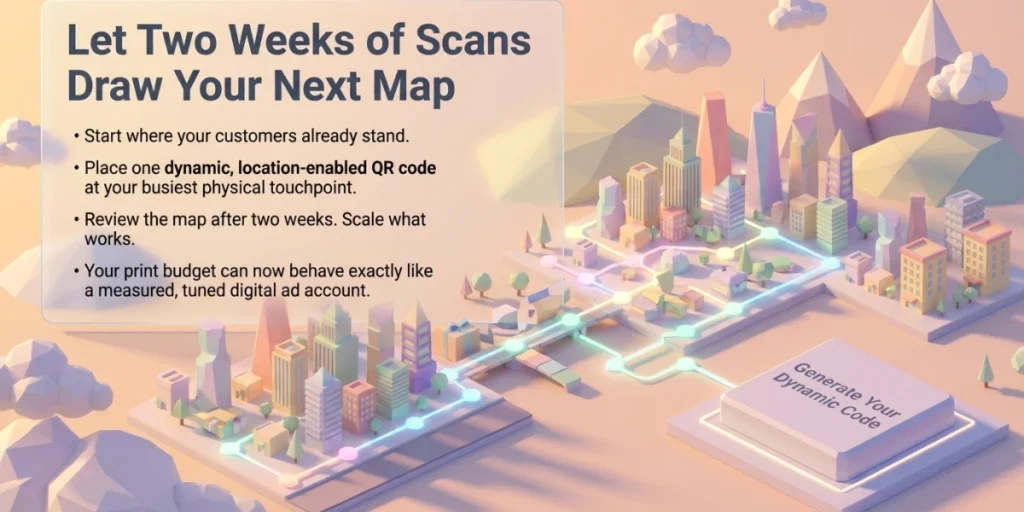
Start where your customers already stand: the storefront window, the product shelf, the table tent, the event banner. Give that placement its own dynamic QR Code, enable location capture, and let two weeks of scans draw the map for you.
QR Code adoption keeps compounding. Our roundup of QR Code statistics paints the full picture, and the direction is clear: more scans, more surfaces, more signal. Brands that track where those scans happen will out-place, out-target, and out-spend their competitors with the same budget.
The playbook is short. Pick one placement. Give it a dynamic QR Code with location capture on. Read the map after two weeks, then scale what worked. Repeat this for every new placement, and your print budget starts behaving like a paid ads account: measured, compared, and tuned.
We built Scanova’s analytics for exactly this job. Create a dynamic QR Code, switch on location capture, and watch your first scan map take shape.
H. FAQs: QR Code Location Tracking
1. Can someone track me through a QR Code without my knowledge?
No one can get your exact position from a QR Code without your consent. Precise GPS data requires you to approve a visible prompt in the browser. Scanning a dynamic code reveals a rough, IP-based area, such as your city, while static codes log nothing.
2. How accurate is the location data from a QR Code scan?
IP-based data is accurate to the city level, though mobile networks can shift it by a few miles. GPS-based data is far tighter and typically lands within a few meters of the scanner. Accuracy also depends on the phone’s signal and whether the user granted location access.
3. Do static QR Codes track scan locations?
No. A static QR Code points straight to its destination with no redirect in between, so there is no server to record the scan. Only dynamic QR Codes can log scan counts, timestamps, devices, and locations. This is why nearly all business QR Codes today are dynamic.
4. Is it legal to track where QR Codes are scanned?
Yes, in general, as long as you stay transparent and collect consent where the law requires it. Under the GDPR, precise location tied to a person counts as personal data and needs a lawful basis. Rules differ by country and state, so confirm your setup with legal counsel.
5. Can I see QR Code scan locations in Google Analytics?
Yes, if you add UTM parameters to your QR Code’s destination URL. GA4 will then report the city-level location of those visitors along with their on-page behavior. Use your QR dashboard for scan events and GA4 for what happens after the click.
6. How do I see my QR Code scans on a map?
Open the analytics section of your QR Code dashboard. In Scanova, the geo-location view lists scans by country and city, and plots permitted GPS scans as pins on a map. You can filter by date range and export the data for deeper analysis.