QR Code Analytics: The Data Behind Every Scan (And Why It Matters) | Scanova
In a nutshell: QR Code analytics helps you track every scan, when, where, and by whom. This is so that you can measure real-world campaign performance, understand your audience, and make smarter marketing decisions. This guide breaks down how QR Code tracking works, what data you can collect, how top brands are using it, and how to get started with tools like Scanova. Whether you’re new to QR Codes or ready to go beyond the basics, this article will show you how to turn every scan into a valuable insight.
Let’s start with a quick question.
When was the last time you printed a QR Code on a flyer, a poster, or a product package… and then had no idea if anyone actually scanned it?
As per a 2023 stat by We Are Social, ~44.6% of internet users aged 16-64 scan a QR Code each month.
Do you know how much value lies behind a single QR Code scan?
Don’t worry. You’re not alone. Most marketers either skip QR Codes entirely or use static ones that don’t tell you anything. It’s like launching a campaign and covering your eyes.
But here’s the good news: QR Code tracking is a thing. It’s super useful. And it’s way easier than you think.
In this quick guide, I’ll show you how QR Code Analytics works and what kind of data you can track.
Most importantly, I’ll show you how that data can help you run smarter, more effective campaigns. No jargon. No fluff. Just stuff that makes you a better, more data-driven marketer.
Because here’s the thing:
Top marketers already use QR Code Analytics to track performance, fine-tune messaging, and get real results from their offline campaigns. And once you see how it works, you’ll wonder why you weren’t doing this all along.
A. What is QR Code analytics (And why should you care?)
Let’s break it down, because not all QR Codes are created equal.
If you’ve ever generated a free QR Code and slapped it on a poster or product, chances are it was a Static QR Code.
These are the “what you see is what you get” type. Once they’re printed, that’s it. You can’t edit the link, and you get zero tracking. It’s like handing out flyers in the dark and hoping someone bites.
Now enter the hero of our story: the Dynamic QR Code. This is what the best marketers use.
Unlike Static QR Codes, Dynamic QR Codes use a short, redirecting URL. This means:
- You can track every scan
- You can edit the destination even after printing
- And most importantly, you get data (the stuff marketers love)
This is where QR Code Analytics comes in.
QR Code Analytics simply means tracking and analyzing scan data. Things like:
- How many people scanned your code
- Where they were
- When they scanned it
- What device they used
- And even which campaign drove more engagement
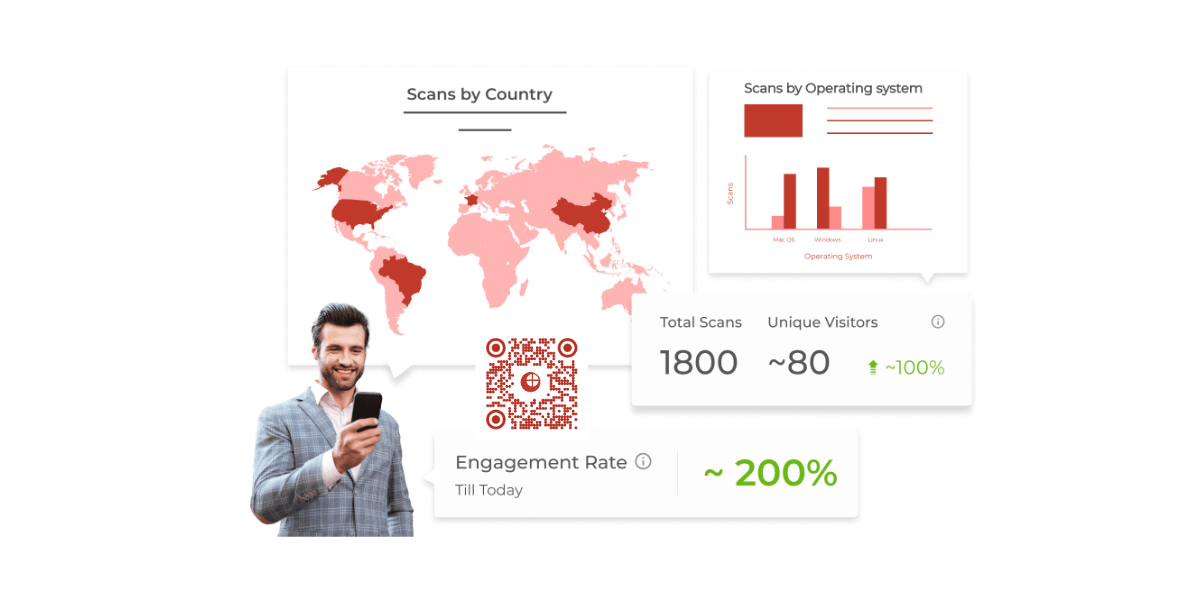
QR Code generators such as Scanova make all of this easy, with real-time dashboards that turn anonymous scans into valuable insights.
You don’t need a data science degree to use it. It’s all laid out for you, ready to fuel better marketing decisions.
Most professional QR Code generators boast of over 50-100 million scans per year (each). And these are just the ones that were ‘trackable’.
B. How QR Code tracking works?
Let’s walk through what actually happens when someone scans a QR Code. And why Dynamic codes make all the difference.
1. Step-by-Step: What happens when a QR Code is scanned
- Scan: The user points their smartphone camera at the QR Code
- Redirect via Short URL: With a dynamic QR Code, that scan hits a short URL (hosted by your QR platform like Scanova) that logs info and routes the user to the final destination page
- Logging Data: The platform records the scan event, capturing details like time, location (IP-based), device type, and referrer. This gives you real-world usage insights
- Destination Load: The user lands on your webpage or content, optionally tracked with UTM parameters, so your analytics tool (like Google Analytics) logs campaign info
2. Why Dynamic QR Codes are power-packed
- Editable on the fly: You can change the destination URL anytime (even after printing) without reissuing a new code
- Trackable metrics: Every scan becomes a data point you can act on—location, device, time stamp, repeat vs unique scans
3. What does that look like in practice?
Think of it as a pipeline: Dynamic QR Code ➝ Short URL server logs scan ➝ Redirect to destination ➝ Analytics dashboard & Google Analytics receive data
With QR Code Generators like Scanova, this process is seamless. You get a dashboard showing real-time scan counts, geographic spread, device breakdown, and campaign comparisons, all in one place.
This is why marketers who really care about performance never use Static QR Codes. Dynamic QR Codes give you the power to learn, optimize, and prove ROI.

C. What data can you track using QR Codes (with real-world examples)
One of the biggest advantages of using Dynamic QR Codes is that you can actually track what’s happening. Every scan becomes a data point you can learn from.
Here’s a full breakdown of the different types of data you can track, what they mean, and how brands are using them to make real decisions.
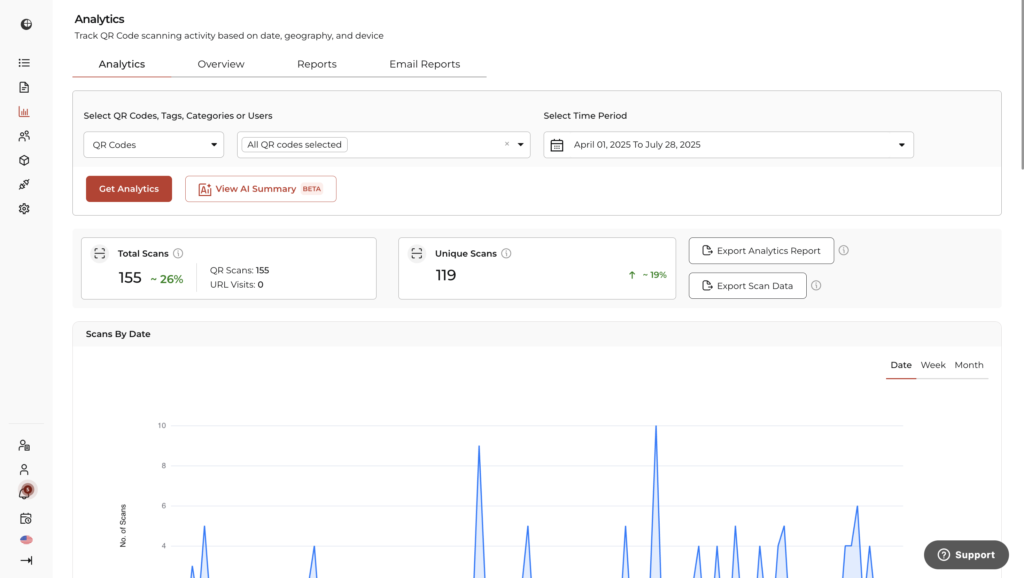
1. Total Scans
This is the total number of times your QR Code was scanned, including repeat scans. It tells you how much overall attention your code (and campaign) received.
Why it matters:
If you’re running a regional promotion with 10,000 flyers, and your QR Code gets only 50 scans, something’s off. Maybe the placement, design, or messaging needs work. On the flip side, a spike in scans could indicate that your campaign is gaining traction.
Real-world example:
Travel With Us, a travel experiences company, generated over 14.35 million scans across their campaigns using Scanova. That huge volume told them their digital upgrade was working and helped justify cutting down on printed brochures.
2. Unique Scans
This tells you how many individual devices scanned your code, essentially removing duplicates from repeat scans.
Why it matters:
If your code got 1,000 total scans but only 200 unique scans, that means a small group is highly engaged. That’s great for loyalty, but it’s also a sign that you might need to expand reach. It helps avoid misleading “vanity metrics.”
Scenario use:
Say you’re running a QR Code-based lead generation campaign at a trade show. Knowing you had 500 unique visitors scan and not just 10 team members testing it repeatedly gives your sales team real insight.
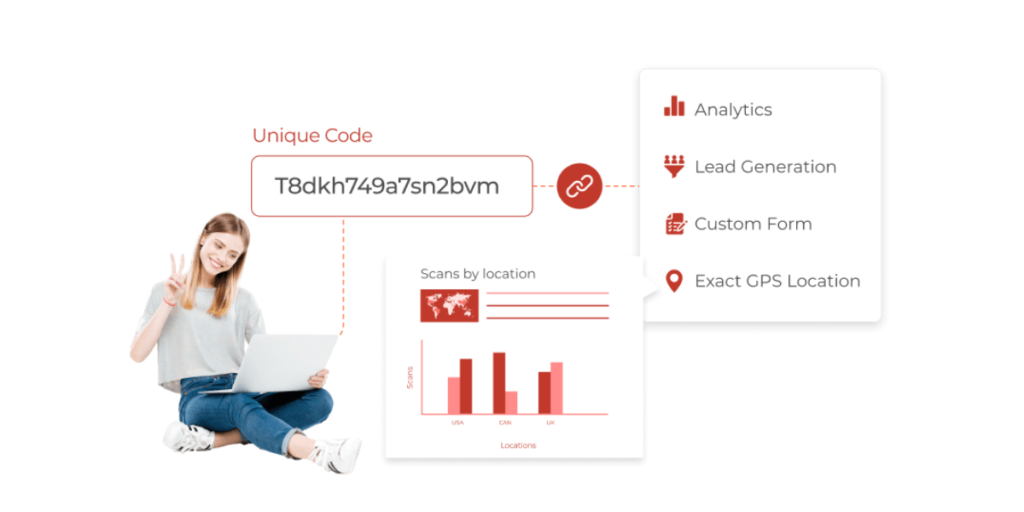
3. Leads Data (Who scanned the QR Code?)
QR Codes aren’t just for tracking how many people scanned them. They can also help you understand who they are.
Using lead generation forms, you can collect details such as:
- Name
- Phone number
- Company
- Any custom field relevant to your campaign
Why it matters:
This turns anonymous engagement into qualified marketing leads, especially effective for events, brochures, product demos, or gated content like whitepapers.
Example:
A B2B SaaS company prints QR Codes on booth banners at an expo. When scanned, attendees fill out a short form to access a product brochure. This generates pre-qualified leads synced directly to their CRM.
Platforms like Scanova allow you to create these forms directly within your QR Code, and track submission data alongside scan analytics.
4. Location Data
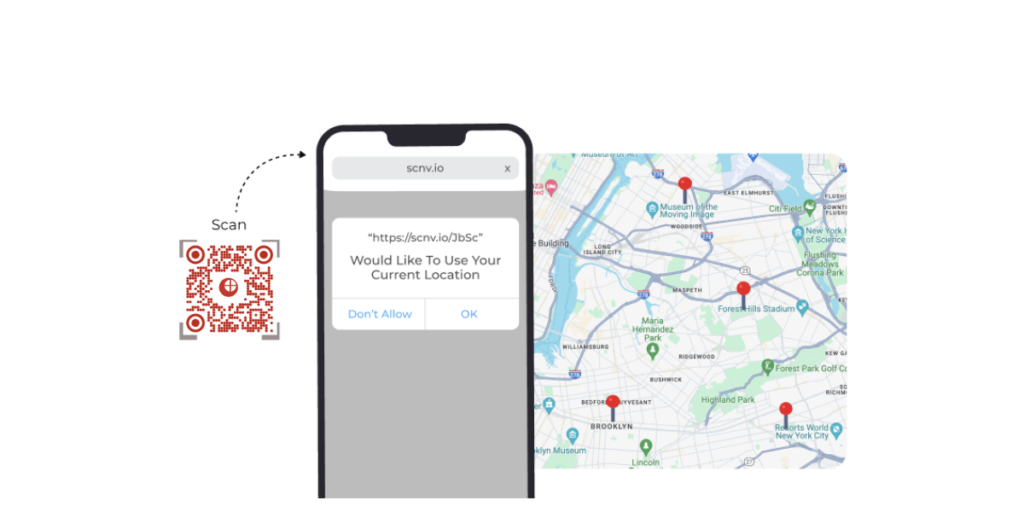
You can track where scans are happening: by country, state, city, and sometimes even GPS coordinates (if users allow it).
Why it matters:
This data is gold for regional targeting. If most of your scans are coming from Chicago but your ad spend is going into New York, you know something needs to shift. You can also find new markets where demand is picking up unexpectedly.
Real-world example:
DART (Dallas Area Rapid Transit) used location data to identify which transit stops had the highest scan volumes. This helped them place QR Codes more strategically and even reassign staff to handle peak traffic.
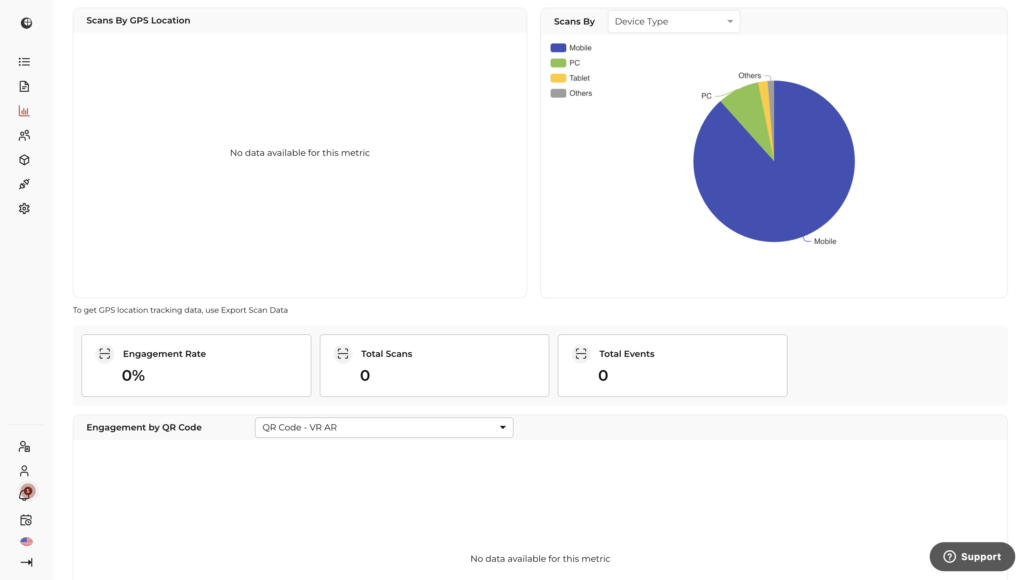
5. Device Type & Operating System
QR analytics tools can show you whether the scan came from Android or iOS, and whether it was on mobile, tablet, or desktop. Also, which mobile browser (Chrome, Safari) was used?
Why it matters:
This helps you tailor your post-scan experience. If 90% of your users are on Android, test your landing page on those devices first. If it’s mostly mobile, make sure your content is short, snappy, and mobile-optimized.
Real-world example:
AutoZone noticed the majority of scans came from Android users. They used this insight to improve mobile app performance specifically for Android and saw a boost in app downloads and engagement.
6. Scan Timestamps
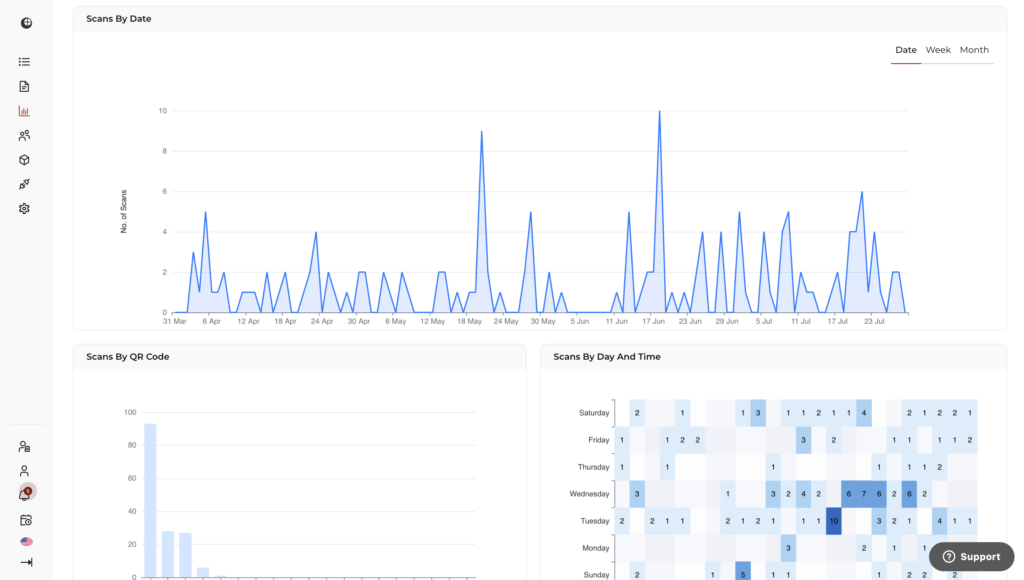
QR analytics logs the exact date and time each scan happens.
Why it matters:
This helps you identify peak engagement times. Maybe people scan your codes during weekday mornings, or maybe it spikes on Sunday evenings. This tells you when to launch your next promotion or schedule a time-sensitive campaign.
Scenario use:
Let’s say you’re testing different call-to-actions (CTAs) in an outdoor ad campaign. Timestamps help you spot patterns, like if the “Limited Time Offer” version is triggering more scans on weekends.
7. Referral Source
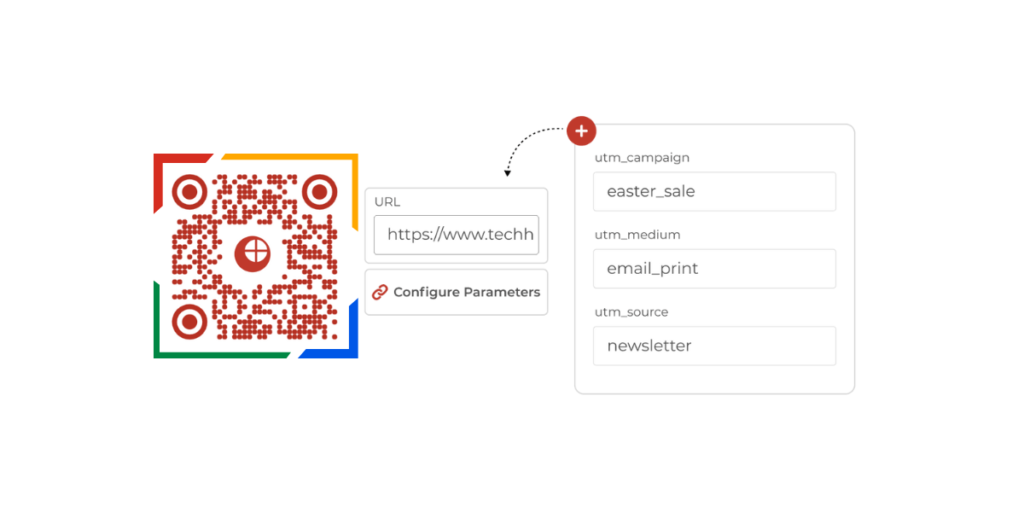
If you’re using UTM parameters or tracking multiple placements of the same QR Code, you can identify which marketing channel drove the scan—print ad, poster, event stall, product packaging, social media, etc.
Why it matters:
Now you can attribute your offline conversions back to specific campaigns, just like you do with digital ads. It’s critical for calculating ROI.
Real-world example:
L’Oréal ran QR Codes on NYC taxi ads and magazine pages. With separate tracking links, they found that magazines led to 80% more app downloads, guiding their future ad budget toward print.
8. Engagement Metrics (Post-scan Behavior)
Some platforms let you track what happens after the scan. Whether users clicked a button, filled out a form, watched a video, or bounced.
Why it matters:
It’s not just about getting people to scan; it’s about what they do next. If lots of people scan but don’t take action, maybe your landing page needs work. If engagement is high, that’s proof that your message is resonating.
Scenario use:
You run two flyers. One with a generic “Scan to Learn More,” and one with “Scan to Get 10% Off.” Engagement metrics show that the second version led to double the conversions.
9. Export & Reporting
With tools like Scanova, you can export this data into spreadsheets or receive automated reports via email.
Why it matters:
Your team, clients, or leadership needs to see results. Reports make it easier to evaluate performance, prepare presentations, or run in-depth analysis. It also helps automate internal workflows.
Each of these data points tells a story. But when you combine them, they give you a full picture. What’s working, what’s not, and what to do next.
And that’s what makes QR Code analytics so powerful. You’re not just collecting numbers. You’re making data-driven marketing decisions in the real world.

Want to collect leads? You can! Just use a form after the scan. Many brands add a landing page or sign-up form right after the QR Code is scanned. As Daniela Gutierrez from Hitachi Vantara shared,
“We have increased our leads by 10x with Scanova.”
D. Why these analytics matter: Benefits for your campaigns
Let’s be real. Data is only as good as what you do with it.
The magic of QR Code Analytics isn’t just in the dashboards or scan counts. It’s in the decisions you can make because of it. Whether you’re running a local flyer campaign or a nationwide print promotion, these insights help you optimize fast, spend smarter, and hit your goals.
Here’s how real-time QR Code tracking turns into real marketing wins:
1. Understand Your Audience Better
Every scan gives you a tiny window into who your audience is. Where they are, who they are, what devices they use, and when they’re most active.
Why it matters:
You can tailor your messaging, offers, and landing pages based on actual user behavior and not on assumptions.
If your scan data shows that 70% of your traffic comes from iPhones in urban metros, you’ll design very differently than if it’s 80% Android users from Tier 2 cities.
2. Optimize Campaigns in Real Time
Because Dynamic QR Codes let you change the URL after printing, you can tweak and test live campaigns on the fly.
Notice one version of a landing page converting better? Switch the underperforming ones instantly.
Why it matters:
You don’t need to reprint or restart anything. You can fix what’s not working while the campaign is still live.
3. Target Regions That Actually Respond
Location data shows you exactly where your QR Codes are getting traction.
Why it matters:
If you’re getting 80% of your engagement from just 3 regions, you can scale the ad spend in those areas and avoid wasting money elsewhere.
This is especially useful for franchises, regional retailers, or city-specific activations.
4. Run Smarter A/B Tests
You can run two versions of the same QR Code campaign. Different CTAs, offers, and placements, and track them separately using unique URLs.
Why it matters:
You get real-world feedback on what copy, color, or offer performs best. No guesswork. This makes print campaigns as testable and measurable as digital ones.
Scenario: A brand runs two poster variations. One says “Scan to Learn More,” the other says “Scan to Get 10% Off.” By tracking each QR Code separately, they discover the second version drives 3X more engagement.
5. Measure ROI (Even for Print!)
The biggest challenge with offline marketing? Attribution.
But with dynamic QR Codes, you can trace leads, signups, purchases, or app installs directly back to specific campaigns or even placements.
Why it matters:
You finally have hard numbers to justify print budgets. No more “we think it worked”. You’ll know exactly what worked and where.
Insight → Action: L’Oréal used QR Code data to attribute a 130% increase in online sales to a single cross-channel campaign. This helped justify the expansion of the program across 1.5 billion product units.
QR Code Analytics doesn’t just tell you what’s happening. It tells you what to do next.
It helps you:
- Design smarter campaigns
- Speak directly to your real audience
- Make confident, data-backed decisions
- Prove ROI to clients, bosses, or stakeholders
It’s the kind of superpower that turns good marketers into great ones.
E. How to use QR Code analytics with Scanova?
There are several QR Code generators out there that offer analytics, but for this guide, we’ll use Scanova to demonstrate how to set up and use QR Code Analytics in practice.
Why Scanova? It’s one of the more advanced and widely-used platforms with a clean interface, real-time dashboards, and features that are especially useful for marketers and campaign managers.
The best part? You don’t need any technical skills to get started. Let’s break it down:
1. Set Up & Monitor Basic Scan Analytics
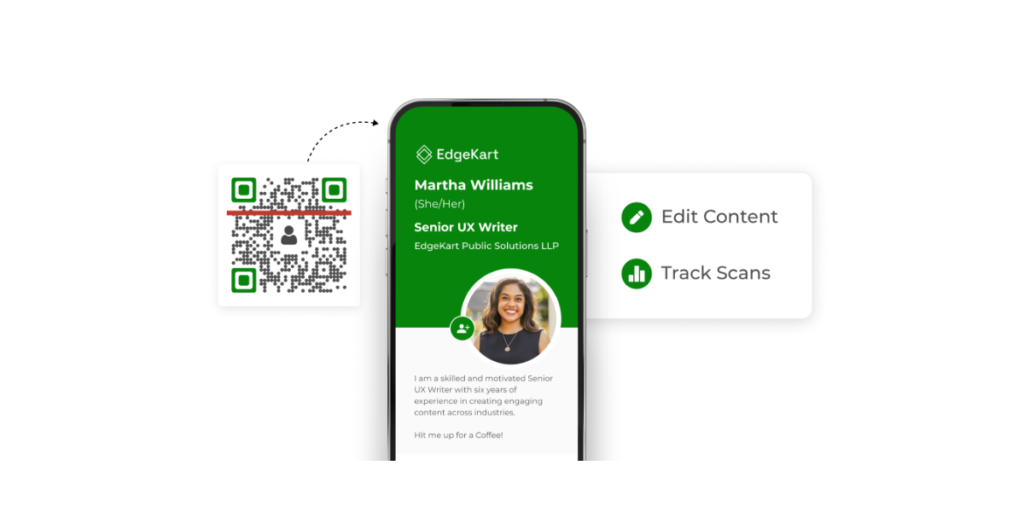
- Create a Dynamic QR Code in Scanova with just a few clicks. No coding needed. It automatically tracks scans as soon as it’s live
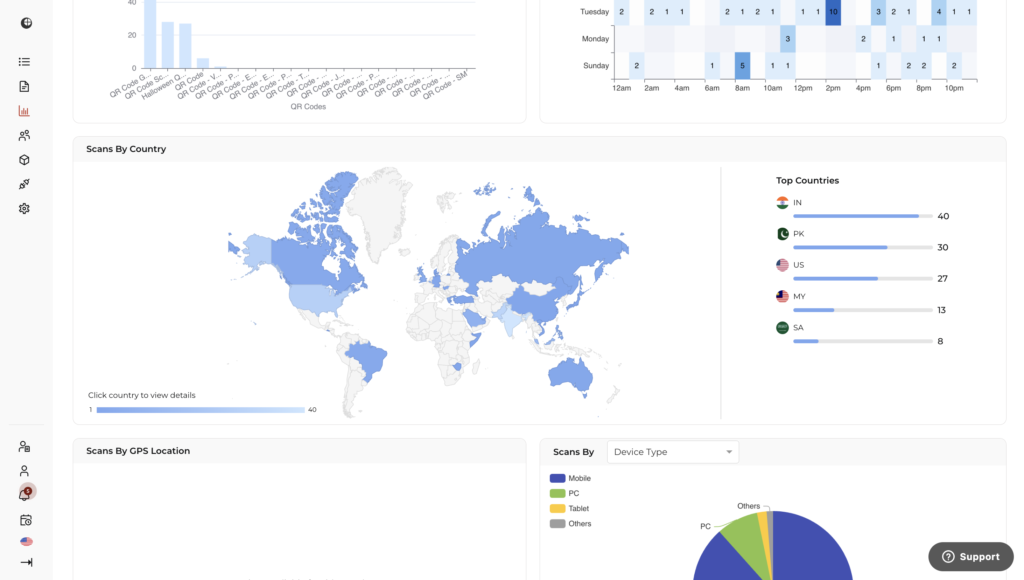
- Visit the Analytics dashboard to see a bird’s-eye view of performance: total scans, scans by date/time, geography (city, country), device, OS type, and even browser
- Get deeper insights. Enable exact GPS tracking (with user permission), view tag-, user-, or category-level analytics to compare campaigns or audiences
Everything is shown in real time, and no technical setup or manual upload is required. Just scan and review.
2. Analytics Integrations & Reporting
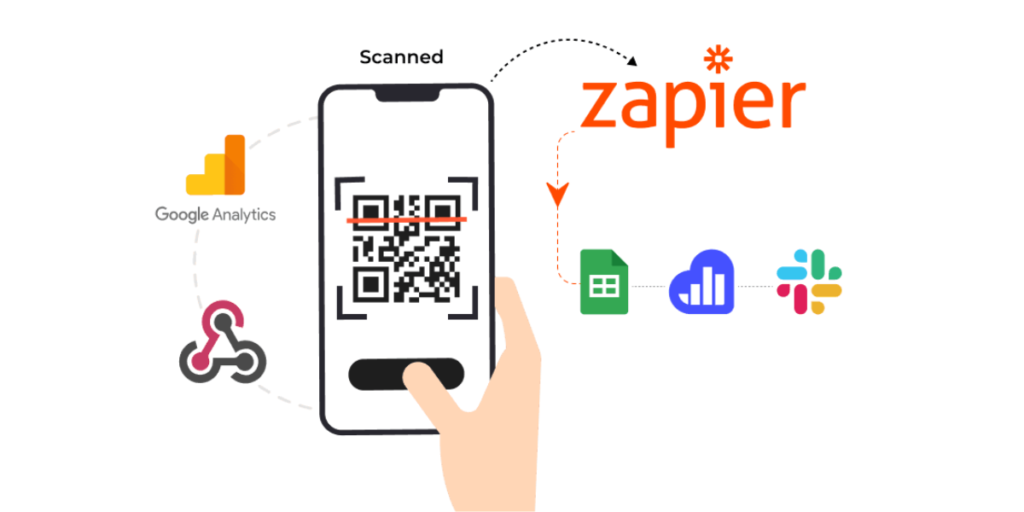
- Google Analytics 4 (GA4): Embed UTM parameters or link Scanova to GA4 so scan data flows directly into your existing analytics dashboard. This lets you analyze scan behavior like any other website traffic
- Webhooks & Zapier: Want scan or event data sent to Slack, Google Sheets, HubSpot, or other tools? Use Scanova’s webhook integration (via Zapier or custom endpoints) to automate workflows
- Email Reports & Data Export: Schedule scheduled analytics reports to be emailed regularly, or download detailed or aggregated scan data in CSV or Excel. Great for team sharing or stakeholder reporting
3. Lead Generation & Lead Tracking (Who Scanned the Code)
Scanova makes it easy to turn scan traffic into qualified leads—without needing an external landing page builder.
Here’s how it works:
- When creating a Dynamic QR Code, choose the “Lead Generation” campaign type
- Use the built-in form builder to customize fields: name, email, phone, dropdowns, checkboxes, etc.
- Once a user scans the QR Code, they’re prompted to submit the form before accessing the content (like a brochure, coupon, or event registration)
- All submitted data is stored in a Lead List under your account
- You can export this data in Excel or CSV, or receive real-time email notifications every time a new lead submits the form
- Pro users can also integrate with CRMs or automate follow-ups via webhooks. You’ll also see form completion metrics in the analytics dashboard, alongside scan and engagement data
Pro Tip: Combine lead forms with Scanova’s event tracking to measure what users do after they submit, like clicking a button or downloading a file.
4. Advanced Options: Event Tracking, End-User Tracking, and Retargeting
Event Tracking (Pro and Enterprise users only):
- Enable event tracking to monitor how users interact with content on landing pages linked to your QR Code, like button clicks, downloads, or video plays
- Simply assign unique Tracking IDs to buttons or components on your page, and Scanova logs engagement metrics like click counts and engagement rate (clicks ÷ scans). You’ll get visual graphs and exports for analysis
End-User Tracking (optional, with user consent):
- Map individual behaviors if users opt in. Connect scan data, event activity, and lead generation submissions under a unified tracking ID for deeper insights. Ideal for lead workflows and advanced segmentation
Better Targeting with Custom Audiences (Coming Soon in Scanova):
One of the most powerful use cases of QR Code Analytics is the ability to retarget scanners with precision ads across digital channels like Meta, LinkedIn, and Google Display Network. Even when your campaign starts offline.
Here’s how it works:
- Set up a Custom Audience: On platforms like LinkedIn Ads, Facebook/Instagram (Meta Ads), or Google Ads, create a Custom Audience based on website visitors or conversions
- Generate a Pixel Tracking Code: These platforms will provide a small JavaScript snippet (LinkedIn Insight Tag, Meta Pixel, or Google Ads Tag) to help track users who interact with your QR Code landing page
- Embed the Pixel into a Dynamic QR Code: In Scanova (feature launching soon), you’ll be able to add your tracking pixel to the destination URL of a Dynamic QR Code. No coding required
- Place QR Codes on Print Collaterals: Add the Dynamic QR Code to your posters, flyers, product packaging, or brochures
- Capture Offline → Online Behavior: When someone scans the QR Code, the tracking pixel fires, tagging that scanner as part of your custom audience. You can now retarget this highly interested group across Google Display Ads, Meta, or LinkedIn with follow-up ads or offers
Why This Matters: This bridges the gap between offline discovery and online conversion, helping you:
- Improve ad relevance and reduce wasted spend
- Run hyper-targeted remarketing campaigns
- Track true ROI from print campaigns using first-party data
This capability is not yet widely adopted—but it’s a game changer for smart marketers.
Good news: Pixel-based audience targeting will soon be available in the Scanova platform. Stay tuned for release updates.
Scanova turns QR Code tracking into a plug-and-play capability. No developer required. You get:
- Instant scan analytics
- Integration into your existing tools
- Advanced engagement tracking
- And repeatable report automation
It all makes launching, optimizing, and proving ROI on QR campaigns smoother than ever, whether you’re a small business, agency, or enterprise brand.
F. Pro tips for maximizing the value of QR Code campaigns
Now, creating a Dynamic QR Code is easy. But QR Code tracking really matters when you actually get scans. But getting people to scan it, engage with it, and convert—that’s where strategy matters.
Here are some proven tips to help you get the most out of your QR Code campaigns, from design to deployment and beyond.
1. Custom Branding
Make your QR Code look like it belongs to your brand.
- Use your brand’s colors, logo, and design language in the QR Code so it feels familiar and professional
- Match the code’s design with your campaign creative (flyers, product labels, event stands) to ensure a consistent visual journey from scan to landing page
- Stick to high-contrast color combinations (e.g., black on white or dark blue on light yellow) to ensure good scannability in real-world conditions
Pro Tip: Think of your QR Code as a clickable ad. Make it as branded and polished as the rest of your campaign.
2. Strategic Placement
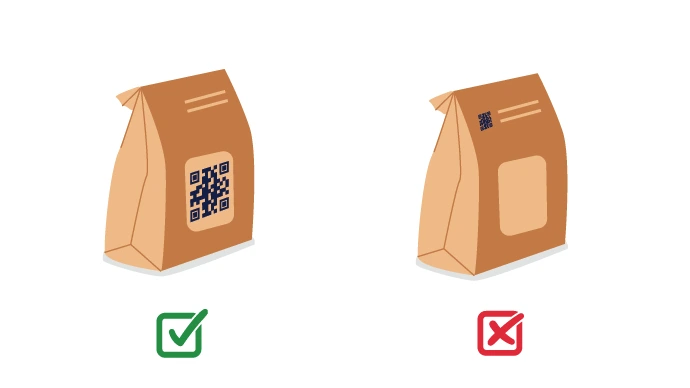
Where you place the QR Code can make or break your campaign.
- Put it where your target audience naturally pauses or pays attention: entrances, waiting areas, packaging, checkout counters, flyers
- Avoid curved or moving surfaces (like coffee cups or balloons). QR Codes scan best on flat, well-lit, accessible areas
- Test your placements in real environments. Lighting glare, folds, or size can affect scan success
Pro Tip: Before you print 10,000 brochures, test the design in the actual lighting conditions you expect.
3. Compelling Calls-to-Action (CTAs)

People won’t scan a QR Code just because it’s there. Tell them why they should.
- Always include a clear, specific CTA right next to the code: “Scan to win a gift,” “Scan to get 10% off,” “Scan for your free eBook.”
- Highlight the value upfront. What’s in it for them?
- Use dynamic landing pages linked to QR Codes that feel personalized or updated, so users don’t feel like they’re getting the same generic link every time
Pro Tip: “Scan Me” isn’t enough anymore. “Scan to unlock your reward” works better.
4. Privacy and Security Considerations
A little transparency builds a lot of trust.
- Clearly state what kind of data (if any) you’re collecting and why
- Always use HTTPS links. They encrypt the connection and show users that your content is secure
- If required, comply with privacy laws like GDPR or CCPA by offering opt-in/out tracking, especially when combining with lead capture forms
- As you scale QR deployments, partnering with a managed cybersecurity service can help enforce policies, continuous monitoring, and incident response across links, landing pages, and integrations.
Pro Tip: Trust equals scans. Security best practices help you avoid bounce rates and legal trouble.
5. Monitor, Test, and Optimize
QR Code campaigns aren’t set-and-forget. Use analytics to fine-tune your results.
- Regularly review your analytics dashboard (e.g., in Scanova) to track scan volumes, locations, device types, and peak times
- Run A/B tests with different CTAs, placements, and designs to see what gets the most scans or conversions
- With Dynamic QR Codes, you can update the destination URL or content on the fly. No need to reprint
Pro Tip: Think of it like digital marketing: monitor, learn, and iterate.
6. Prioritize Mobile Experience
Your landing page is just as important as the code itself.
- Make sure your website, form, or offer loads fast and clean on mobile
- Remove unnecessary steps: minimize typing, use autofill, and offer tap-friendly buttons
- Test your full flow on both Android and iOS. If it breaks for even 10% of your audience, you lose them
Pro Tip: If the scan is the door, your landing page is the welcome. Don’t slam it shut with slow load times or clunky forms.
7. Educate and Nudge the User
Some people still need a gentle push to scan.
- Add a small graphic or 1-line instruction: “Open your camera and point it here.”
- In unfamiliar audiences or age groups, showing the benefit clearly (with icons or examples) boosts engagement
Pro Tip: A QR Code is only useful if people know what to do with it. Don’t assume, guide them.
Think of the QR Code as the start of a journey
The goal isn’t just to get a scan. It’s to guide someone through a frictionless experience, from curiosity to action. When done right, QR Codes can be your most cost-effective tool to connect, convert, and close.
Ready to put QR Code Analytics into action?
You’ve made it this far. So you already know more about QR Code tracking than most marketers out there.
You’ve learned:
- The difference between Static and Dynamic QR Codes
- What data you can track (and why it matters)
- How real brands are using QR Code Analytics to drive results
- And how tools like Scanova make the whole process easy and powerful
Now it’s your turn.
If you want to create QR Codes that don’t just sit there, but actually tell you what’s working, where, and why, then it’s time to give dynamic QR Codes a try.
Here’s a great way to start: Sign up for a free trial of Scanova and create your first Dynamic QR Code. Track some scans. Explore the dashboard. See the data for yourself.
No strings. No credit card. Just insights.
You’ve already put in the effort to learn. Now take that first small step toward running smarter, data-driven campaigns that actually move the needle.
Let the scans begin.
G. FAQs about QR Code Analytics

These frequently asked questions address the most common doubts and practical concerns marketers and business owners have when exploring QR Code Analytics.
1. What is QR Code Analytics?
QR Code Analytics refers to the process of tracking and analyzing scan-related data from a QR Code. This includes metrics like the number of scans, unique users, location, time of scan, device type, and even engagement after the scan.
2. How does QR Code Analytics work?
QR Code Analytics works primarily with Dynamic QR Codes. When someone scans the code, the platform logs the scan in real time (capturing details such as timestamp, device type, location (based on IP), and referral source) before redirecting the user to the destination link. This data is then displayed in visual dashboards for analysis.
3. What kind of data can I track with QR Code Analytics?
With the right platform (like Scanova), you can track:
- Total scans
- Unique scans (by device)
- Date and time of scans
- Geographic data (city, state, country)
- Device & OS used
- Browsers opened post-scan
- Referral channels (e.g., print ad vs. product packaging) via UTM parameters
- Post-scan engagement (e.g., clicks, downloads, submissions)
4. Can static QR Codes be tracked?
No. Static QR Codes cannot be tracked once printed. Only Dynamic QR Codes support analytics, as they use redirect URLs that allow data collection and real-time updates.
5. Can QR Codes tell me who scanned them?
Only if you enable Lead Generation. By adding a form before redirecting to the destination, you can collect personal info (with consent), turning anonymous scans into qualified leads. This is supported by platforms like Scanova.
6. How can QR Code Analytics benefit my campaign or business?
QR Code Analytics can help you:
- Understand who’s engaging with your campaigns
- Optimize placements, CTAs, and timing
- Identify high-performing regions or formats
- Justify ad spend with measurable ROI
- Improve user experiences across devices
- Run and compare A/B versions of the same campaign
7. Are QR Code Analytics secure and privacy-compliant?
Yes. Reputable platforms use HTTPS URLs and comply with privacy regulations such as GDPR and CCPA. No personal information is collected unless the user voluntarily submits it (e.g., through a form after the scan).
8. Can QR Code Analytics be integrated with other marketing tools?
Absolutely. Most advanced platforms offer integrations with:
- Google Analytics (GA4)
- CRM tools like HubSpot or Salesforce
- Marketing automation tools via Webhooks or Zapier.
This allows unified tracking and centralized campaign reporting.
9. What are the best practices for using QR Code Analytics effectively?
- Always use Dynamic QR Codes for full tracking capabilities
- Add clear calls-to-action (CTAs) next to the code
- Test placement for visibility and lighting conditions
- Regularly review analytics and make adjustments in real time
- Design QR Codes with branding and high contrast for better scan rates
- Be transparent about data collection and privacy policies
10. What challenges should I be aware of when using QR Code Analytics?
Some common challenges include:
- Low scan rates due to poor placement or weak CTAs
- Inconsistent scan data across different scanning apps or browsers
- Difficulty interpreting raw analytics into actionable marketing decisions
11. Who should use QR Code Analytics?
Any business or organization that runs offline-to-online campaigns can benefit. This includes:
- Marketers and advertisers
- Retailers and product manufacturers
- Event organizers
- Educational institutions
- Healthcare providers
- Nonprofits and government agencies
Summing Up
QR Code analytics can unlock powerful insights, helping you track engagement, optimize campaigns, and make smarter marketing decisions.
But to get the most out of it, you need the right tool. That’s where Scanova comes in. With dynamic QR Codes, real-time tracking, detailed reporting, and privacy-compliant data collection, Scanova makes it easy to turn every scan into action.
Whether you’re a marketer, event planner, or business owner, Scanova gives you everything you need to track performance, boost ROI, and scale your strategy with confidence.
Ready to take your QR Code campaigns to the next level? Start with Scanova today.
If you’re still reading, you’ve learned everything about QR Code analytics. If you have any questions, let us know in the comments.
